WMT 34-day bullish forecast — Nov 1, 2026
- Bias: Bullish
- Timeframe: 34 days (made Nov 1, 2026, target date Dec 4, 2026)
- Price at analysis: $123.51
- Price target: $126.50
- Expected range: $115.00 – $132.50
- Result: Pending — graded after the close on Dec 4, 2026
Get a free AI analysis of WMT today
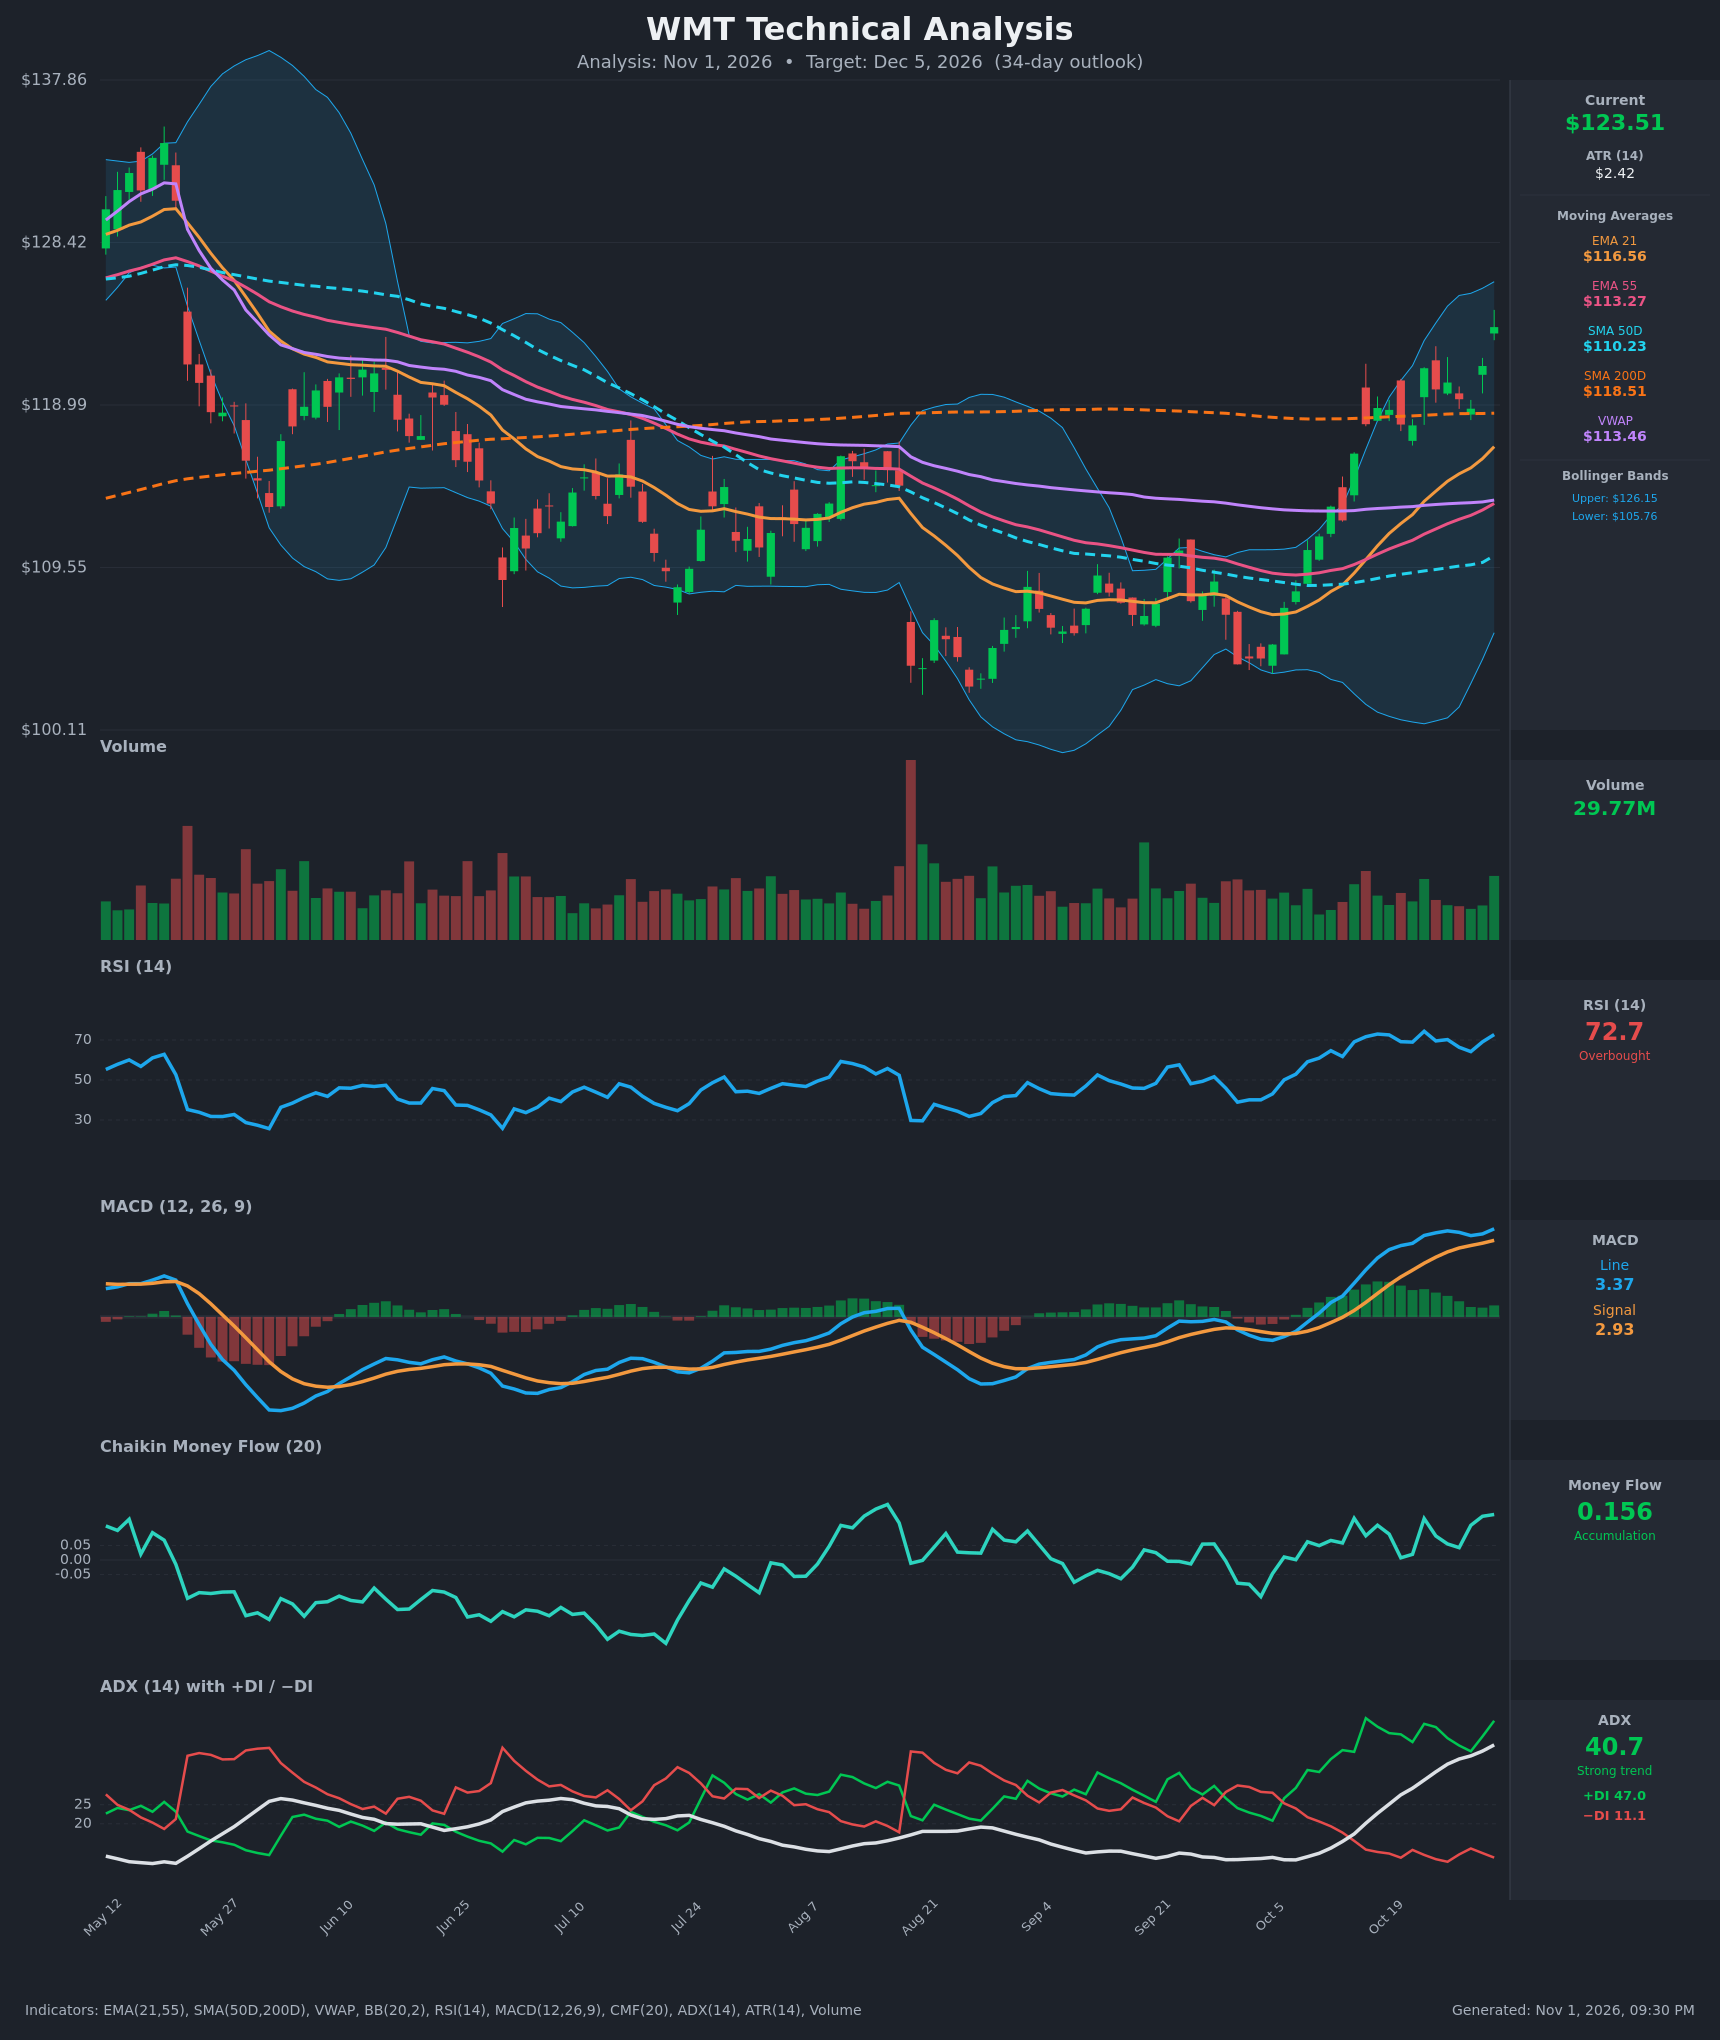
Analysis
TECHNICAL INDICATORS
- RSI (14): 72.7, in overbought territory (>70). It has made a higher low from the Oct 13 reading of 61.7 and is rising again after dipping to 64.2 on Oct 28. Momentum is strong, but the stock is stretched in the short term. [Bullish]
- 20 EMA (EMA 21 = $116.56): Price at $123.51 is about 6% above the EMA 21, which is rising steeply and acts as dynamic support. EMA 21 is above EMA 55 ($113.27), and the bullish cross happened around Oct 15. The distance from the EMA also raises pullback risk. [Bullish]
- MACD: Line 3.365 is above the signal at 2.926, both well above zero. The histogram is positive (+0.44) and re-expanding after a brief narrowing on Oct 28. The line made a fresh high on Oct 30. There is no bearish crossover. [Bullish]
- Bollinger Bands (20): Upper $126.15, lower $105.76. Price is in the upper quarter of the band, with the bands expanding after a squeeze. This is a volatility-expansion breakout, and price is riding the upper half. Tags of the upper band can pause the move, but they often continue in strong trends. [Bullish]
- CMF (20): +0.156, well above +0.05 and positive for the whole 15-bar window. This shows sustained accumulation, and the rally has buying pressure behind it. [Accumulation]
- ADX (14): 40.7 and rising steadily from 13.6 on Oct 12. +DI is 47.0 against −DI at 11.1, a very wide gap with the bulls firmly in control. This is a strong trend, though readings above 40 can precede consolidation. [Strong Trend – Bullish]
- Volume: 29.77M, with the latest bar above the recent average. Volume on the breakout candles is moderate and below the Aug capitulation spike. The advance is supported but not climactic. [Mildly Bullish confirmation]
Moving-average context:
- Price is above the SMA200 ($118.51), SMA50 ($110.23), VWAP ($113.46) and both EMAs.
- It reclaimed the SMA200 around Oct 22 and is holding above it.
- The SMA50 is still below the SMA200, so no golden cross yet. The gap is about $8 and the SMA50 is turning up.
DIVERGENCES & TRENDS
- Divergences: There is no bearish RSI/price divergence. RSI is near its Oct 16 high (73.0) while price is higher, and MACD is making new highs with price. The indicators confirm the price move.
- Trends: ADX, MACD, +DI and CMF are all trending up together. The MAs are fanned bullishly (EMA21 > EMA55 > SMA50, price > SMA200).
- Crossovers and breaks:
- EMA21 crossed above EMA55 around Oct 15.
- Price broke above the SMA200 and has held it since.
- MACD has been above its signal since Oct 13.
- +DI has been well above −DI throughout.
- A golden cross (SMA50 over SMA200) is still pending, so it is not yet confirmed.
- Risk flags:
- RSI above 70 and price pressing the upper Bollinger Band argue for a possible pause or retest of the $118–$121 breakout zone.
- Price sits about 6% above the EMA 21.
CHART PATTERNS
- Bullish Double Bottom: The Aug and Oct lows near $103–$105 form a double bottom. The neckline, around $118–$119 (the Aug/Sep highs and the SMA200 area), has now been broken. The measured move is roughly neckline + depth (about $14), pointing to the low-to-mid $130s. That is the long-range target, and not all of it is likely within 34 days.
- Bullish Flag/Pennant (minor): The Oct 19–28 consolidation at $117.80–$121 was a small flag. The Oct 29–30 breakout from it supports continuation.
- Resistance zones: The $128.40 gridline and the May breakdown region around $129–$133 are the major overhead supply zones.
POTENTIAL SCENARIOS
- Scenario 1: Bullish Trend Continuation — The double-bottom breakout and strong ADX/CMF drive price to test and slightly exceed the upper band. It may pause briefly near $126–$128 before extending. Trigger: a daily close above $126.15 on steady volume. Target: $126.50–$130. Invalidation: a daily close below $118.50 (the SMA200). (50% probability)
- Scenario 2: Neutral/Corrective Pullback and Retest — Overbought RSI and the stretch above the EMA 21 lead to a 3–6% retracement toward the EMA 21 and the breakout zone, with a possible new base before the next leg. Trigger: failure to hold above $123 and a close below $121. Target: $116.50–$119. Invalidation: a reclaim of $124.50 with RSI turning up. (35% probability)
- Scenario 3: Bearish Failed Breakout — Price loses the SMA200 on rising sell volume and the rally proves a bull trap. Trigger: a daily close below $116.50 (the EMA 21) with MACD crossing under signal. Target: $110–$113 (the SMA50/VWAP). Invalidation: a close back above $121. (15% probability)
PRICE TARGETS
- Target Price: $126.50
- Expected Range: $115.00 to $132.50 (width $17.50 ≈ 14.2% of current price, consistent with the 30–60 day guidance)
- Key Levels: Support at $118.51 (SMA200, then the EMA 21 near $116.56), Resistance at $128.40
OVERALL BIAS
OVERALL BIAS: BULLISH - Trend, momentum and money-flow indicators (ADX 40.7 with +DI far above −DI, MACD above signal, CMF +0.156, price above all key MAs including the SMA200) point higher, and the double-bottom neckline breakout supports further upside. Conviction is moderate because RSI is overbought and price is extended above the EMA 21, so a pullback to $118–$121 before continuation is possible.
This is educational analysis and not financial advice.