BAC 48-day bullish forecast — Nov 1, 2026
- Bias: Bullish
- Timeframe: 48 days (made Nov 1, 2026, target date Dec 18, 2026)
- Price at analysis: $50.01
- Price target: $52.00
- Expected range: $47.00 – $54.80
- Result: Pending — graded after the close on Dec 18, 2026
Get a free AI analysis of BAC today
Analysis
TECHNICAL INDICATORS
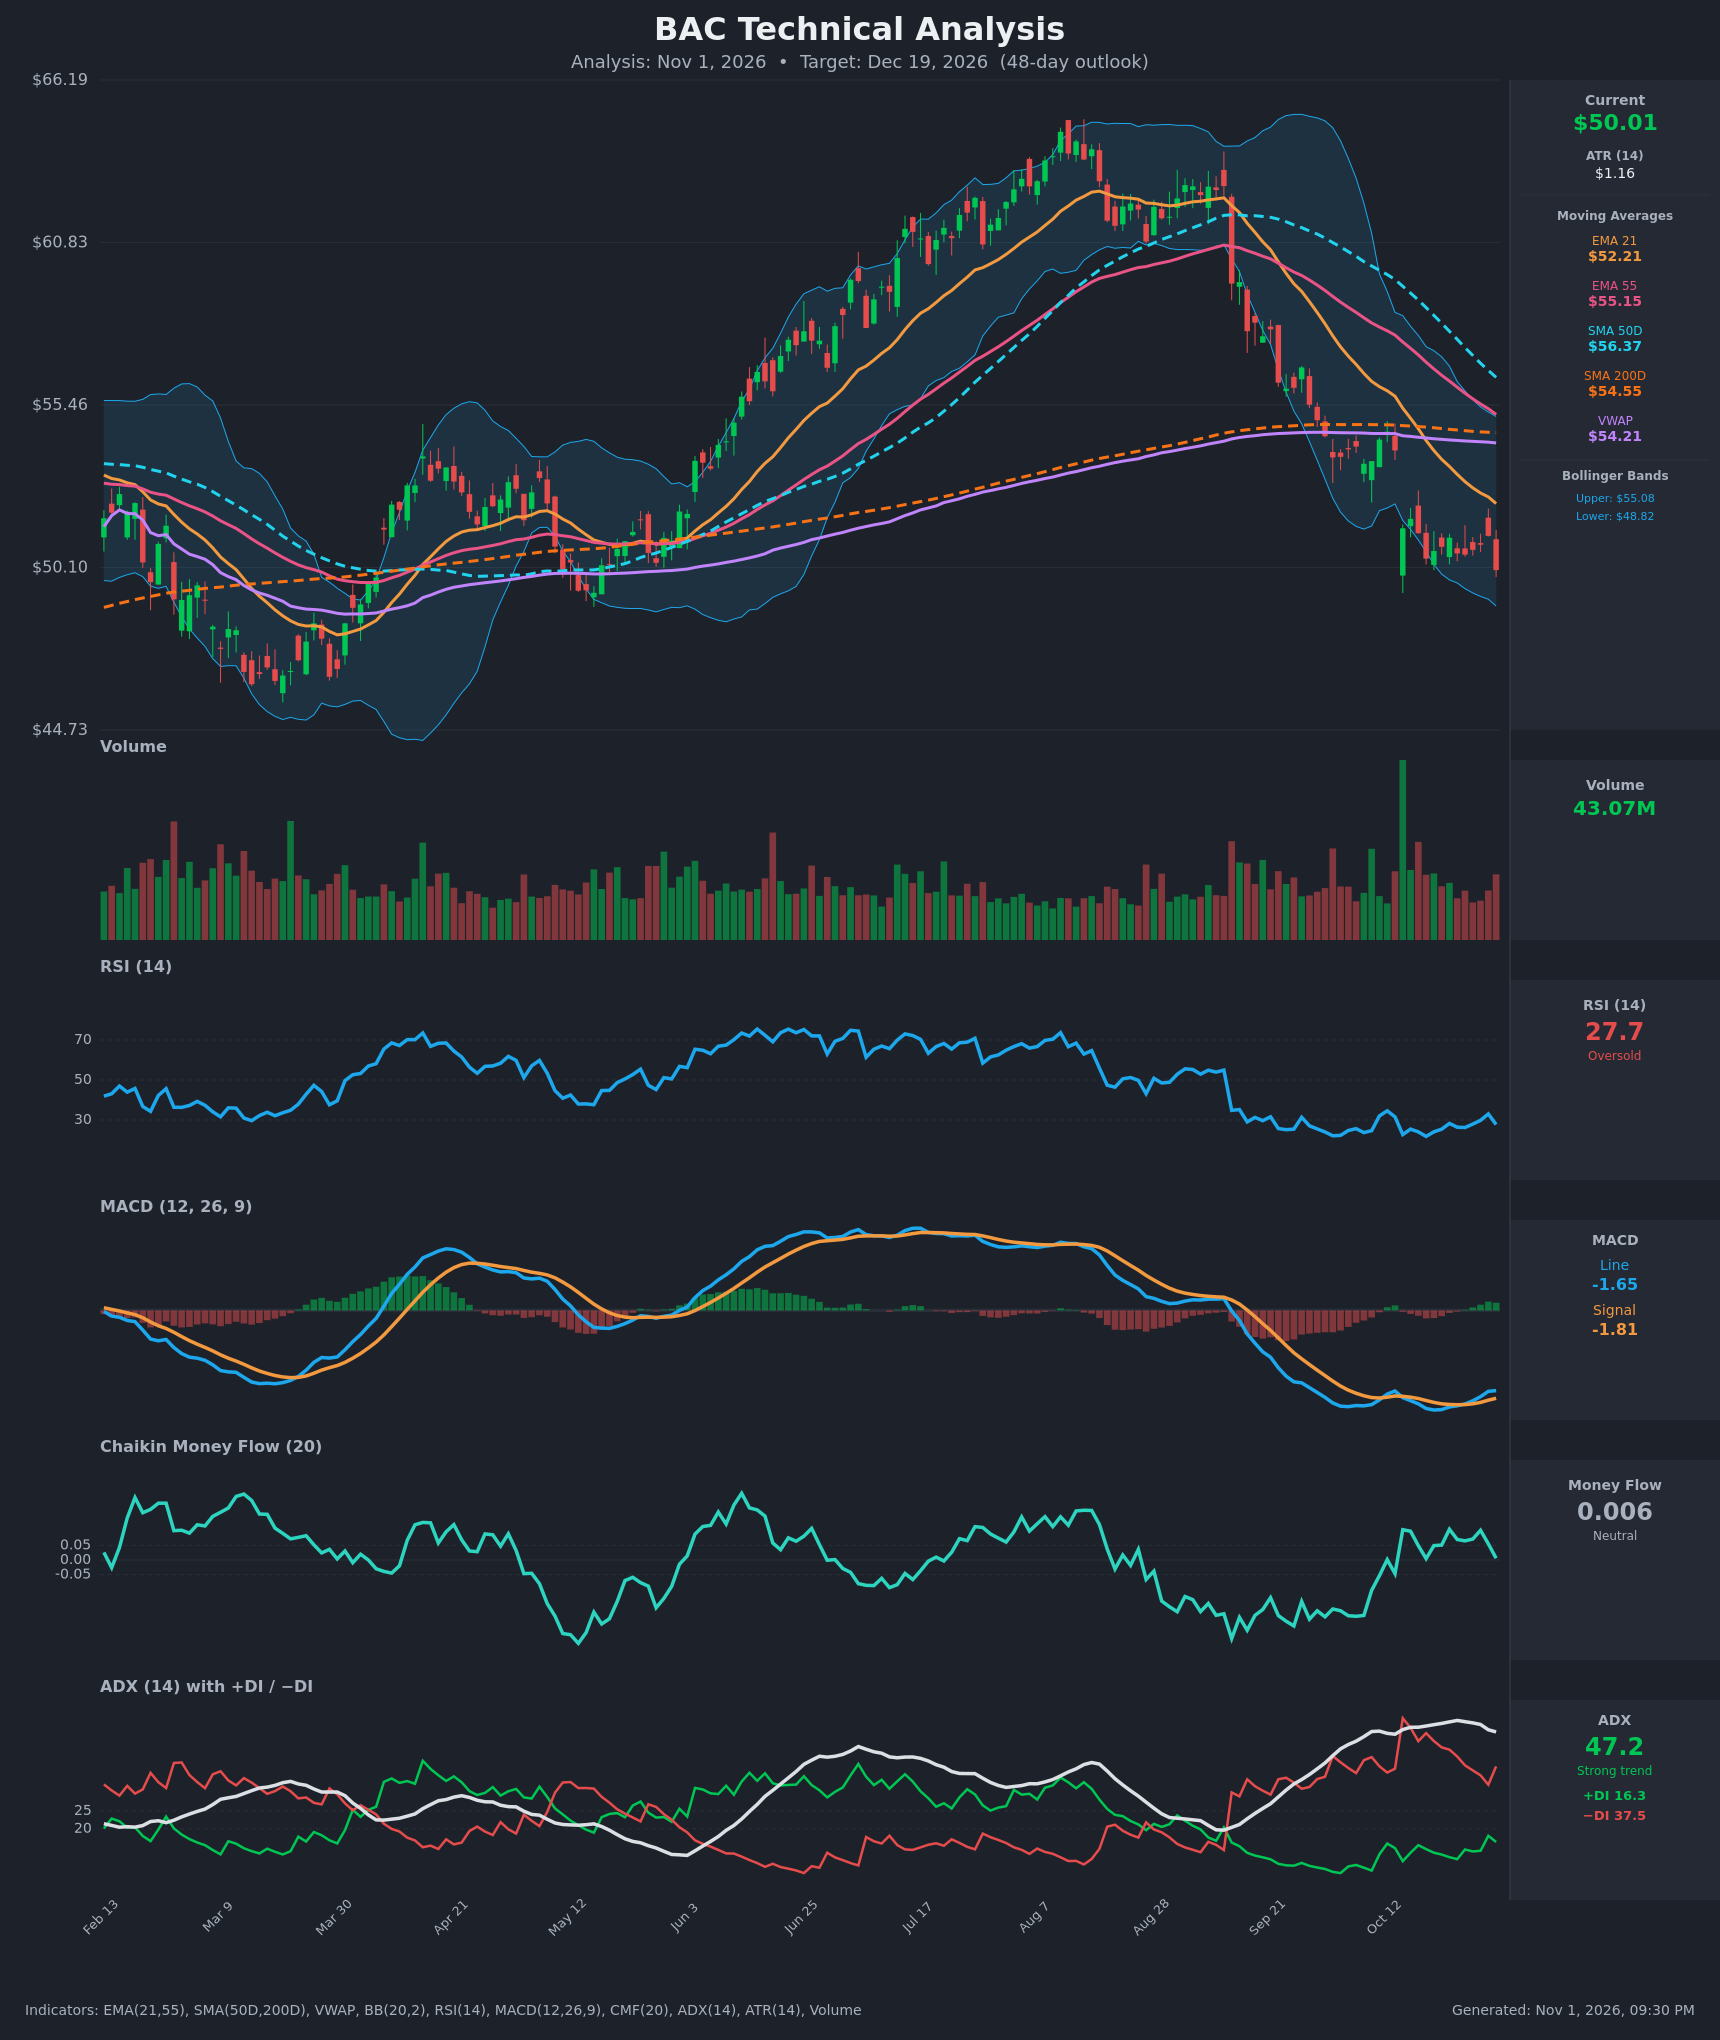
- RSI (14): 27.73, in oversold territory. It bottomed at 21.8 on Oct 19 and has since made higher lows (24.1, 26.2, 27.7) while price made equal or lower closes. Today's drop from 33.0 shows momentum is still fragile. [Neutral]
- 20 EMA (EMA 21): $52.21, with price at $50.01 about 4% below it. The EMA is sloping down steeply and acts as overhead resistance. EMA 21 is also below EMA 55 ($55.15), so the short-term trend is down. [Bearish]
- MACD: Line -1.649 is above Signal -1.807, a bullish crossover that began around Oct 26-27. The histogram is slightly positive and rising, but both lines are deeply negative, so this is only a bottoming signal. [Bullish]
- Bollinger Bands (20): Upper $55.08, lower $48.82, with price in the lower quarter of the band, about $1.2 above the lower band. Bands have started to narrow after the August-October expansion. The "walk the band" decline is losing steam, but no mean-reversion signal has triggered yet. [Neutral]
- CMF (20): 0.006, inside the neutral band (±0.05). It has faded from +0.10 in mid-October and is hovering near zero. That shows no real accumulation and no heavy distribution. [Neutral]
- ADX (14): 47.2 with −DI (37.5) far above +DI (16.3). This is a very strong downtrend. ADX has slipped from its 50.4 peak, and −DI has come down from 51, so selling pressure is easing. Readings this high often precede exhaustion or consolidation, but bears are still in control. [Strong Trend – Bearish]
- Volume: 43.07M, around average. There was a heavy-volume capitulation spike in mid-October, followed by quieter trade during the base at $50-51. Today's red candle closed below that base on ordinary volume, which is not a decisive breakdown. [Neutral / Slightly Bearish]
DIVERGENCES & TRENDS
- Bullish divergence: Price made a new closing low at $50.01, below $50.39 on Oct 19. RSI is at 27.7 versus 21.8 then, and MACD (-1.65 versus -2.05) is also much higher. Momentum is no longer confirming the lows.
- Trend structure: Price is below EMA 21, EMA 55, SMA 50D ($56.37), SMA 200D ($54.55) and VWAP ($54.21). SMA 50D is falling quickly toward SMA 200D, so a death cross is likely within weeks, which is a lagging bearish headwind.
- Crossovers: The MACD bullish cross is recent. The DI spread is narrowing (−DI down from 51 to 37.5), but +DI has not crossed above −DI.
- Distance from the mean: Price is more than 4% below EMA 21 and about 8% below SMA 200D, after a roughly 24% decline from the ~$65 peak. That sets up a technical bounce, though today's new low shows the bounce hasn't started.
CHART PATTERNS
- Bearish Flag / Rectangle (continuation): After the sharp September-October drop, price consolidated in a tight $50-51.4 range. Today's close at $50.01 sits at the bottom of that range. A decisive break below ~$49.30 would project a measured move toward ~$46-47.
- Bullish Falling Wedge / Double Bottom (reversal, tentative): The Oct 14-19 lows near $50.4 and today's $50.01 form a possible double bottom, supported by the RSI and MACD higher lows. Confirmation needs a close above ~$51.4, with a target near EMA 21 / the gap area at $52.2-$54.
- Pattern verdict: The two patterns conflict. Momentum divergence and oversold conditions slightly favor a reversion bounce over 48 days, while the trend and the rangebound base favor a retest of the lows first.
POTENTIAL SCENARIOS
- Scenario 1: Bullish Oversold Mean-Reversion Bounce — The momentum divergence, oversold RSI and MACD cross lead to a relief rally toward the falling EMA 21. Price likely stalls under the EMAs and fills part of the gap. Trigger: daily close above $51.40 with RSI back above 35. Target: $52.20-$54.00. Invalidation: close below $48.80 (lower Bollinger Band). (45% probability)
- Scenario 2: Bearish Trend Continuation — The consolidation resolves lower in a bearish-flag-style breakdown, with the death cross adding pressure. ADX above 45 shows the trend still has momentum. Trigger: close below $49.30 on rising volume. Target: $46.50-$47.50. Invalidation: close above $52.20. (40% probability)
- Scenario 3: Neutral Base Building — Price chops in a $48.50-$52.50 range, working off oversold conditions without a clear break. Trigger: ADX falling below 35 with price oscillating around $50-51. Target: $50-$51.50. Invalidation: close outside $48.50-$52.50. (15% probability)
PRICE TARGETS
- Target Price: $52.00 (48-day horizon)
- Expected Range: $47.00 to $54.80. The width is $7.80, about 15.6% of the current price, which is in line with the 30-60 day guidance of 12-18%.
- Key Levels: Support at $48.80, Resistance at $52.20
OVERALL BIAS
OVERALL BIAS: BULLISH - Price is deeply oversold (RSI 27.7) with a bullish MACD crossover, a bullish RSI/MACD divergence versus the latest lows, and falling −DI, which favors a reversion toward the EMA 21 zone (~$52) over 48 days. Conviction is modest because ADX 47 and a stack of overhead moving averages leave a real risk of a break below the $50 base.
This is educational analysis and not financial advice.