BB 48-day bearish forecast — Nov 1, 2026
- Bias: Bearish
- Timeframe: 48 days (made Nov 1, 2026, target date Dec 18, 2026)
- Price at analysis: $8.42
- Price target: $8.05
- Expected range: $7.40 – $8.80
- Result: Pending — graded after the close on Dec 18, 2026
Get a free AI analysis of BB today
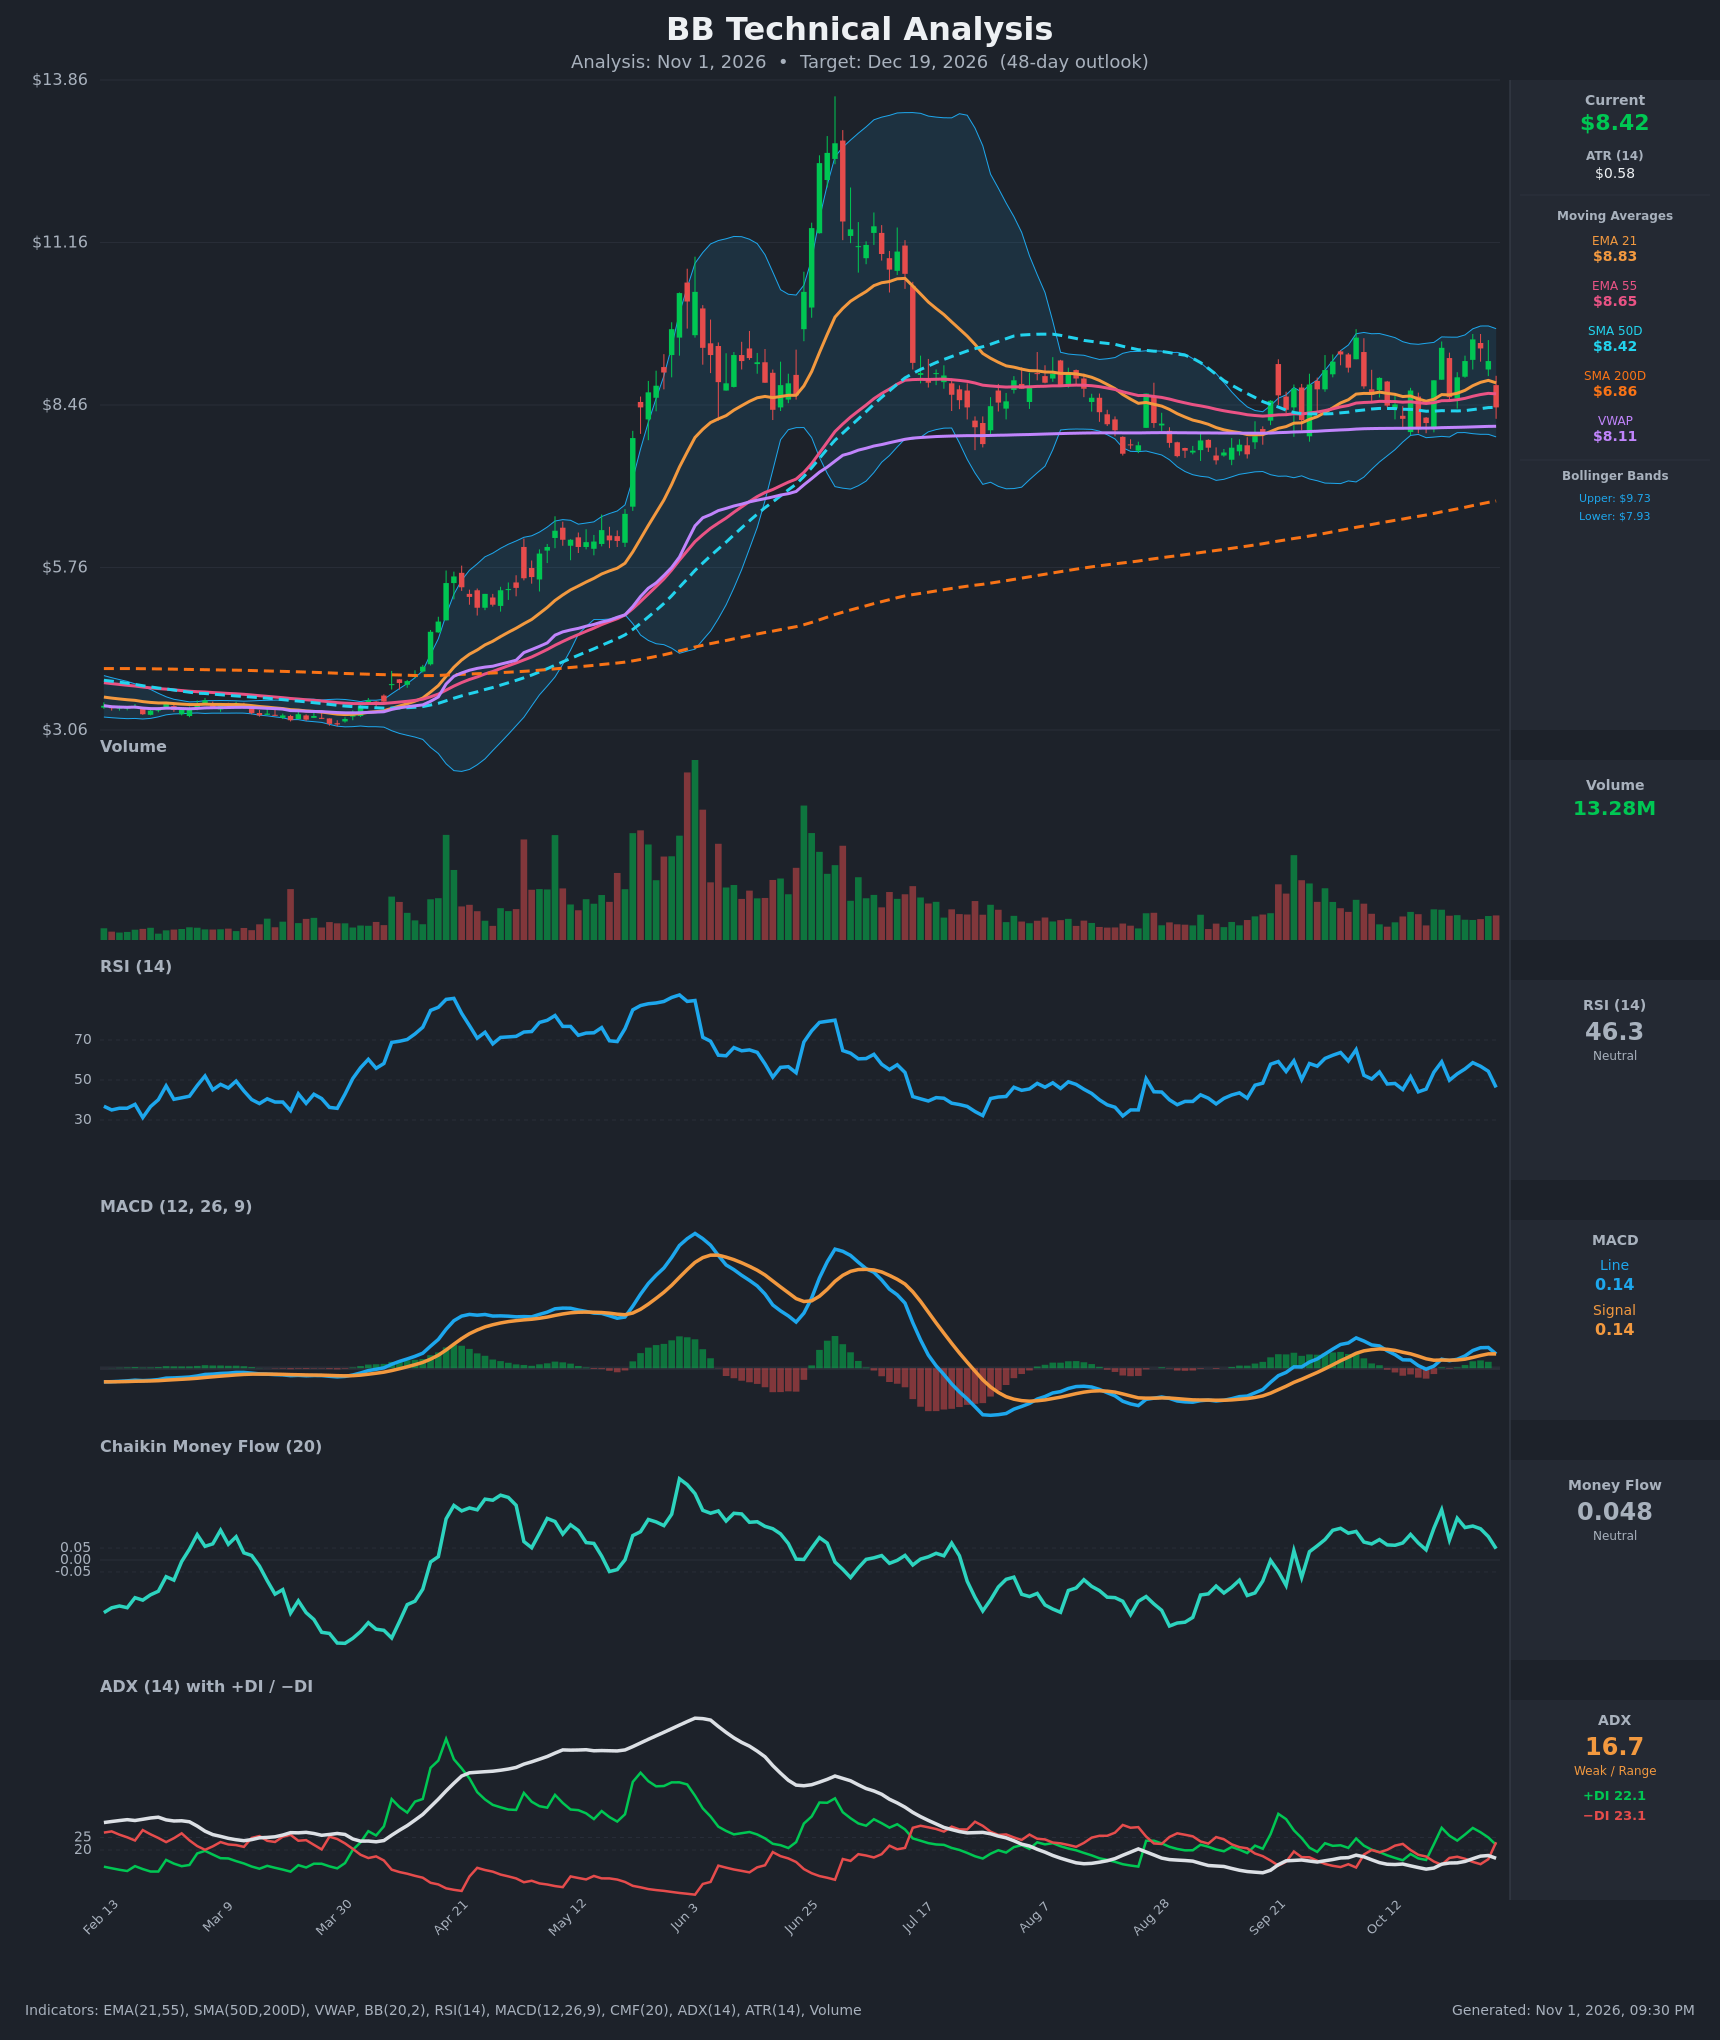
Analysis
TECHNICAL INDICATORS
- RSI (14): 46.29, down from 54.4 two sessions ago and 59 on Oct 21. It has dropped back under the 50 midline after failing to reach overbought, so momentum is fading but not oversold. [Bearish]
- 20 EMA: The data gives EMA 21 at $8.83. Price at $8.42 is about 4.6% below it, so the EMA is now overhead resistance. EMA 21 is also above EMA 55 ($8.65), so the medium-term structure is still constructive. [Bearish]
- MACD: Line 0.137 and signal 0.137 are essentially equal, so the bullish cross of late October has been fully erased. The line fell from 0.199 to 0.137 in one bar and the histogram is flat at zero. A bearish cross is likely on the next weak bar. [Bearish]
- Bollinger Bands (20): Upper $9.73, lower $7.93, middle about $8.83. Price fell from the upper half (the $9.55 high on Oct 27) to below the midline. Bands are moderately narrow, which suggests a range, with the lower band about 6% below price. [Bearish]
- CMF (20): 0.048, just under the +0.05 accumulation threshold and falling from 0.21 on Oct 21. Buying pressure is draining out, and the reading is now neutral. [Neutral]
- ADX (14): 16.7, below 20, so the trend is weak or range-bound. −DI (23.1) has crossed back above +DI (22.1) after +DI led at about 29 on Oct 21 and 27 on Oct 28. The slight bearish edge is not backed by trend strength. [Weak Trend, slight bearish tilt]
- Volume: 13.28M, in line with the recent average and far below the April–June spikes. The Oct 30 drop (−8.4% in two sessions) came on ordinary volume, so there is no panic selling. Rallies have not drawn strong volume either. [Neutral/Mildly Bearish]
DIVERGENCES & TRENDS
- No clear divergence. The late-October high of $9.55 was matched by MACD at 0.199 and RSI near 59, so momentum confirmed the move before it reversed.
- Price has dropped back through EMA 21 ($8.83) and EMA 55 ($8.65) and now sits at SMA 50 ($8.42). That is the first real support test, and a daily close below it would be bearish.
- Price is above VWAP ($8.11) and well above the rising SMA 200 ($6.86). The long-term uptrend is intact, and SMA 50 is above SMA 200 (golden cross long established).
- The MACD and DI changes are fresh signs of weakening momentum. CMF has turned down from 0.21 toward the neutral zone, and ADX remains below 20.
- The Oct 21 and Oct 27 rallies (+DI near 29) were both sold into. Price has failed to hold above $9.40 since mid-August.
CHART PATTERNS
- Sideways range or rectangle (Aug–Oct): Price has traded roughly $7.40–$9.55 since August. The October push to $9.55 was a failed breakout at the top of that range. The range projects roughly $7.40–$9.50 until a decisive break.
- Possible small rising wedge or double-top-like failure: The highs at $9.41 (Oct 21) and $9.55 (Oct 27) with a fall back to $8.42 echo a Bearish Double Top. A close below the $8.06–$8.16 swing lows would confirm it, with a measured move toward $7.40–$7.60.
- Long-term structure: The larger base-and-advance from $3 remains bullish, but the $13 peak and subsequent lower highs show a long consolidation. This consolidation is the dominant pattern.
POTENTIAL SCENARIOS
- Scenario 1: Bearish Failed Breakout Retest of Range Lows — Price fails at the EMA 21/55 cluster, loses SMA 50 and the Oct 16 low near $8.06, and drifts toward the lower Bollinger Band and the range floor. Trigger: daily close below $8.06 with MACD crossing below signal. Target: $7.40–$7.90. Invalidation: close above $8.85 (EMA 21). (45% probability)
- Scenario 2: Neutral Range Chop — Price holds the $8.05–$8.15 area (VWAP/SMA 50) and oscillates under EMA 21 within the established range. Trigger: ADX stays below 20 and RSI stays at 45–55. Target: $8.10–$8.90. Invalidation: close outside $7.90–$9.00. (30% probability)
- Scenario 3: Bullish Breakout — Buyers defend SMA 50, MACD re-crosses upward, and price reclaims EMA 21 and retests the $9.55 high. Trigger: close above $8.85 followed by a break of $9.55. Target: $9.55–$10.00. Invalidation: close below $8.05. (25% probability)
PRICE TARGETS
- Target Price: $8.05 (48-day)
- Expected Range: $7.40 to $8.80. Width is $1.40, or 16.6% of the current price, which fits the 30–60 day guidance of 12–18%.
- Key Levels: Support at $8.11 (VWAP), with deeper support at $7.93 (lower Bollinger Band) and $7.40. Resistance at $8.83 (EMA 21), then $9.55.
OVERALL BIAS
OVERALL BIAS: BEARISH - Price has fallen below EMA 21 and EMA 55 to SMA 50, RSI is falling below 50, MACD has collapsed onto its signal line, −DI has retaken +DI, and CMF is fading after a failed push to $9.55. ADX below 20 and the rising SMA 200 limit the downside, so the expected move is a modest drift toward VWAP and the range lows rather than a collapse.
This is educational analysis and not financial advice.