IWM 48-day bullish forecast — Nov 1, 2026
- Bias: Bullish
- Timeframe: 48 days (made Nov 1, 2026, target date Dec 18, 2026)
- Price at analysis: $279.33
- Price target: $288.00
- Expected range: $262.00 – $303.00
- Result: Pending — graded after the close on Dec 18, 2026
Get a free AI analysis of IWM today
Analysis
TECHNICAL INDICATORS
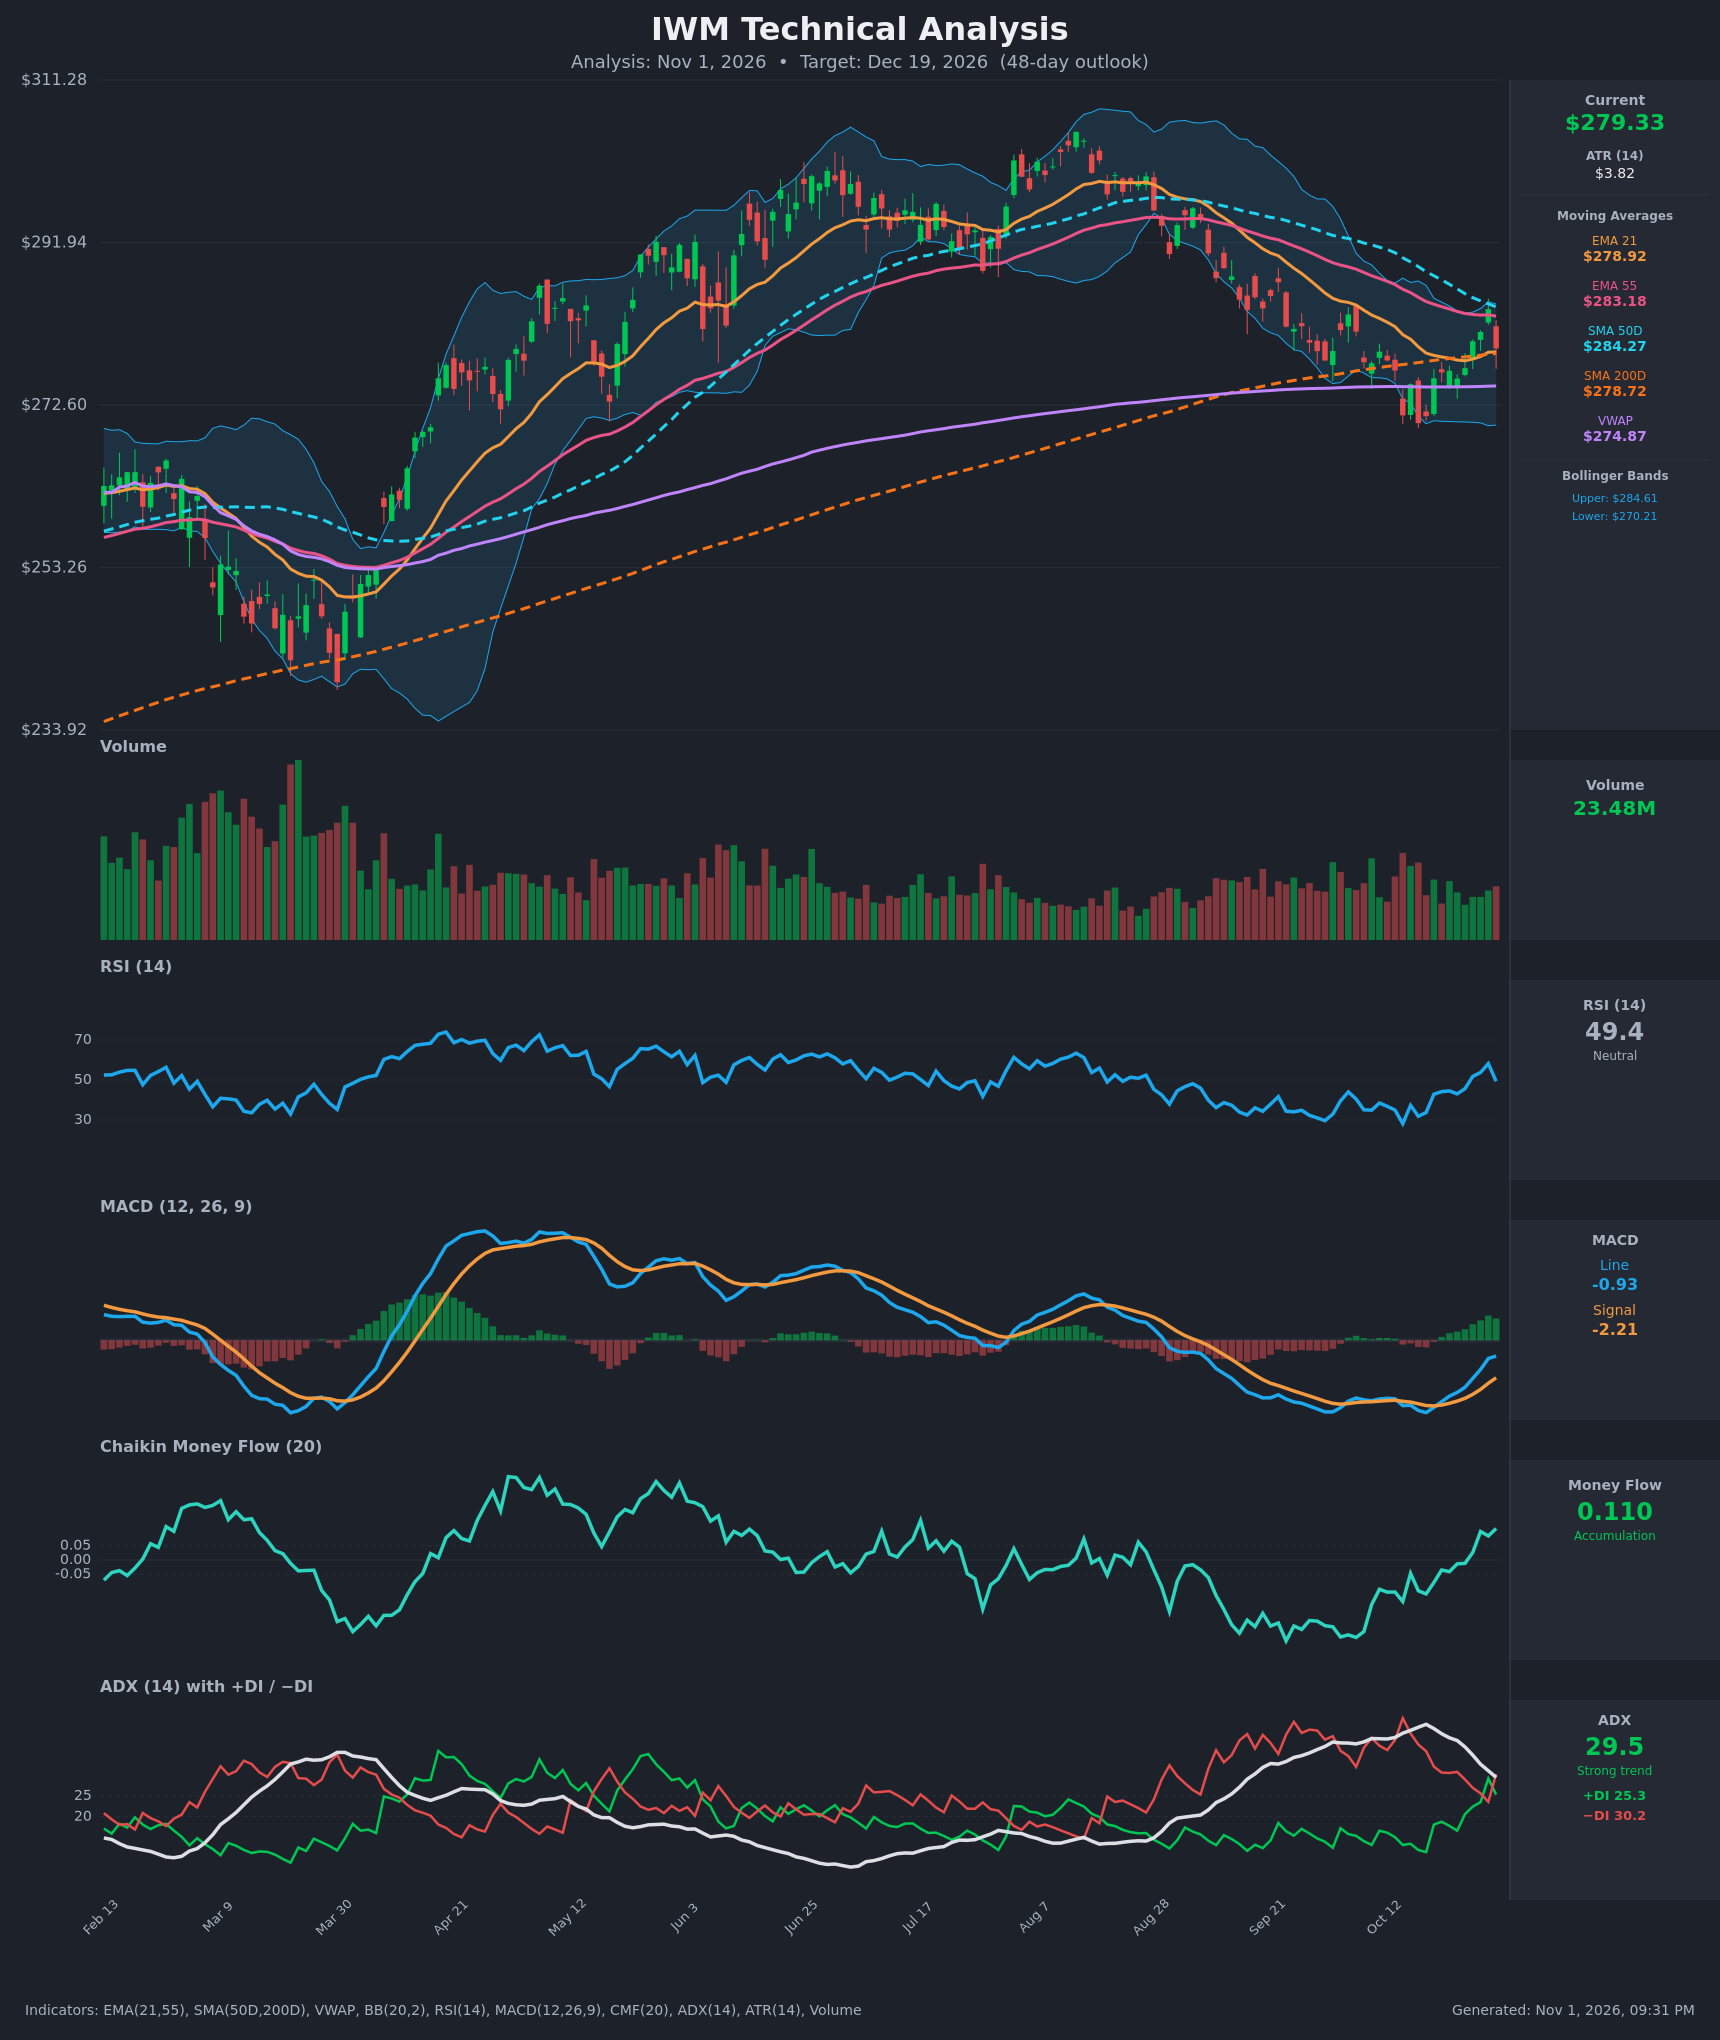
- RSI (14): 49.38, dead neutral. It rolled over from 58.2 on Oct 29 after a strong recovery from the 28-32 oversold zone in mid-October. The trend since the lows is still up, but the last bar shows momentum stalling at the midline. [Neutral]
- 20 EMA (21-period: $278.92): Price at $279.33 sits just above it, so the EMA is acting as thin support. It has flattened and turned up after a long decline. The EMA 55 ($283.18) and SMA50D ($284.27) are overhead resistance, and EMA21 remains below EMA55, so the bearish crossover is still in force. [Neutral]
- MACD: Line -0.93 versus signal -2.21, with a positive and expanding histogram. The bullish crossover happened around Oct 20-26. Both lines are still below zero but rising steeply, which is improving momentum, though a move above zero is not yet confirmed. [Bullish]
- Bollinger Bands (20): Upper $284.61, lower $270.21, with price in the upper-middle of the band (about 63% of the range). The bands are narrowing after the August-October selloff. The upper band coincides with the SMA50D and EMA55, creating a resistance cluster at $283-285. [Neutral]
- CMF (20): +0.110, above the +0.05 threshold and rising from deeply negative readings in September-October. This shows real accumulation on the bounce. [Accumulation]
- ADX (14): 29.5 and falling from a 42 peak. −DI (30.2) is still above +DI (25.3), but the gap has narrowed sharply from 36 vs 12. The downtrend is still technically "strong" but is losing force. A +DI/−DI bullish cross is close. [Strong but fading Trend, bearish-leaning]
- Volume: 23.48M, near average and unremarkable, with no clear expansion on the bounce. Volume on up days has been modestly better than on down days. The recovery is not yet backed by conviction volume. [Neutral-to-mildly supportive]
DIVERGENCES & TRENDS
- Bullish divergence (resolved): Price made a lower low on Oct 16 ($270.44) while RSI (31.9) and MACD (-4.14) were still weak, and both have since turned up sharply. CMF improved from about -0.12 to +0.11, confirming accumulation.
- Moving averages: Price is above the SMA200D ($278.72, long-term uptrend intact) and above VWAP ($274.87). It is still below the falling EMA55 and SMA50D. The SMA50D is above the SMA200D, so there is no death cross, but the gap has narrowed to about $5.5 and could close if the weakness resumes.
- Crossovers: The MACD bullish crossover is confirmed. The −DI/+DI gap is closing but not yet crossed. On Oct 29 price pierced the SMA50D area ($284.01), then reversed to $279.33, a rejection (-1.65% on the day) at resistance. RSI fell from 58.2 to 49.4 on that rejection.
- Trend of indicators: Momentum (MACD, CMF) is improving while price is capped at resistance. This is a classic transition phase, with the outcome decided by the $284-285 break.
CHART PATTERNS
- Bullish Double Bottom (reversal): Lows at about $271.37 (Oct 14) and $270.44 (Oct 16) held above the SMA200D area and the lower Bollinger Band. The neckline is the swing high near $284-285, which is the same resistance cluster as the SMA50D, EMA55 and upper band. A confirmed close above $285 would give a measured target of about $285 + ($285 - $270.4) ≈ $299-300.
- Broader context: The August peak (about $306) to the October low looks like a corrective descending channel. A bearish alternative is a failed rally under the 50/55-day averages, resuming the downtrend toward $270 and then $262-265.
- The pattern is incomplete until the neckline breaks. The rejection on Oct 30 shows this level is a real hurdle.
POTENTIAL SCENARIOS
- Scenario 1: Bullish Double-Bottom Breakout — Accumulation (CMF +0.11) and the MACD upturn carry price through the $284-285 confluence, and +DI crosses above −DI. Trigger: daily close above $285 on rising volume. Target: $295-300 (neckline measured move), with $288-290 as the typical 48-day landing zone. Invalidation: daily close below $270.20. (48% probability)
- Scenario 2: Bearish Rejection and Retest of Lows — The failure at the SMA50D/EMA55 persists, −DI stays on top, and the SMA200D support at $278.72 gives way. Trigger: daily close below $278 and then below $274.87 (VWAP). Target: $268-270, with an extension to $262-265. Invalidation: close above $285. (32% probability)
- Scenario 3: Neutral Range Chop — Price oscillates between the SMA200D/VWAP floor and the $284-285 ceiling as ADX decays below 20 and the Bollinger Bands tighten. Trigger: repeated failures at both $270 and $285. Target: $274-284. Invalidation: close outside $268-$288. (20% probability)
PRICE TARGETS
- Target Price: $288.00 (48-day horizon, about +3.1%)
- Expected Range: $262.00 to $303.00 (width $41 ≈ 14.7% of current price, in line with the 30-60 day guidance)
- Key Levels: Support at $270.40 (October double-bottom lows and lower Bollinger Band; the nearer $278.72 SMA200D is the first line of defense), Resistance at $284.61 (upper Bollinger Band, SMA50D and EMA55 cluster)
OVERALL BIAS
OVERALL BIAS: BULLISH - A confirmed MACD bullish crossover, CMF accumulation at +0.11, a double-bottom forming above the SMA200D, and a weakening ADX downtrend (the −DI lead is shrinking) favor an eventual break of the $284-285 resistance cluster. Conviction is modest because price is still below the EMA55 and SMA50D and −DI remains above +DI.
This is educational analysis and not financial advice.