SMCI 48-day bearish forecast — Nov 1, 2026
- Bias: Bearish
- Timeframe: 48 days (made Nov 1, 2026, target date Dec 18, 2026)
- Price at analysis: $32.95
- Price target: $30.50
- Expected range: $26.00 – $35.50
- Result: Pending — graded after the close on Dec 18, 2026
Get a free AI analysis of SMCI today
Analysis
TECHNICAL INDICATORS
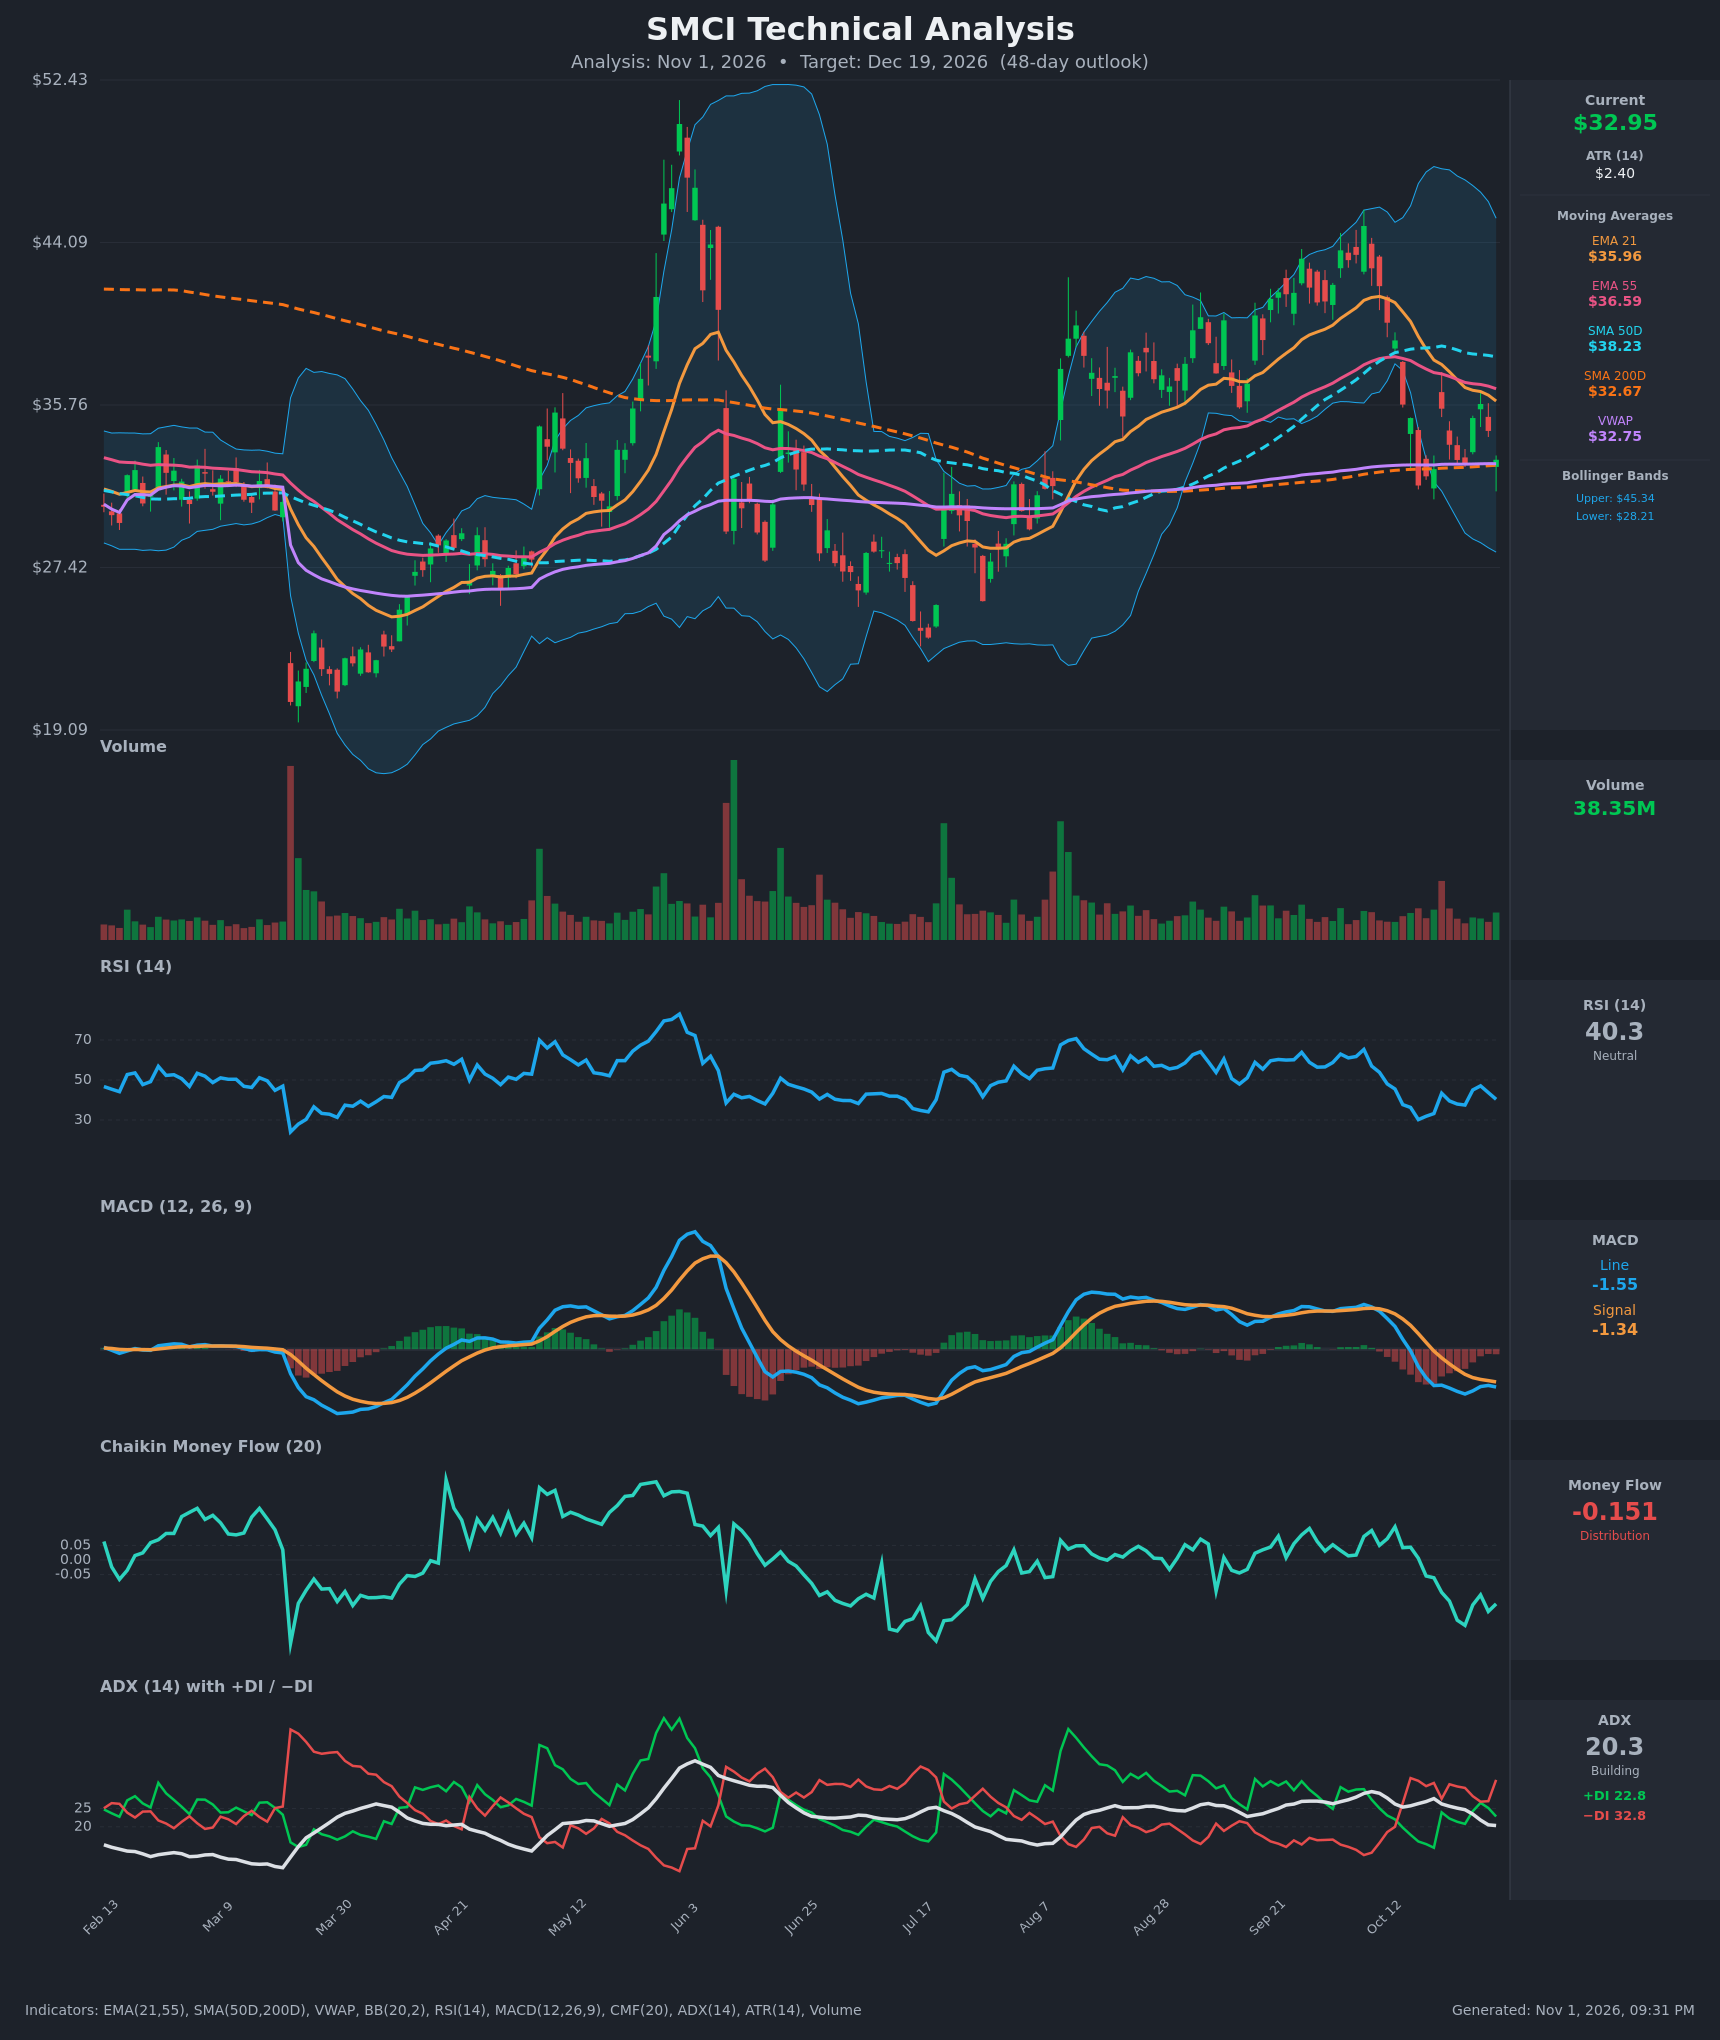
- RSI (14): 40.35. It dropped to about 30 on Oct 16, bounced to 47 on Oct 28, and has rolled over again. It is below 50 and has made lower highs, so momentum is weak but not oversold. [Bearish]
- 20 EMA (EMA 21): $35.96, with price at $32.95 about 8% below it. The EMA 21 is below the EMA 55 ($36.59), a bearish cross that happened around Oct 23. The EMA 21 is now declining and acts as overhead resistance. [Bearish]
- MACD: Line -1.55 is below Signal -1.34, and both are below zero. The line crossed below the signal on Oct 20 and the histogram is slightly negative. The line has been flattening since late October, so downside momentum is easing but not reversing. [Bearish]
- Bollinger Bands (20): Upper $45.34, lower $28.21, midline about $36.8. Price sits in the lower half, about 28% of the way up the band. The bands are wide, reflecting high volatility. There is no squeeze, and a retest of the lower band near $28 is plausible. [Bearish]
- CMF (20): -0.151, well below -0.05. It has been negative since Oct 19 and keeps falling, which shows persistent distribution. [Distribution]
- ADX (14): 20.3, falling from about 27.8. That is borderline and the trend is weakening. -DI (32.8) is above +DI (22.8), so sellers still lead, though the trend is not strongly established. [Weak Trend + Bearish]
- Volume: 38.35M, roughly average, with no capitulation spike on the October selloff. The big red bars on Oct 14 to 16 showed selling pressure, and the bounce volume was unremarkable. [Neutral-to-Bearish]
DIVERGENCES & TRENDS
- Moving averages: Price is $32.95, essentially on top of the SMA200D ($32.67) and VWAP ($32.75). This is a key support cluster. SMA50D ($38.23) is above SMA200D, so there is no death cross yet, but the SMA50D is rolling over.
- RSI divergence: On Oct 16 price made a low at $31.63 with RSI at 30.2. The latest dip to $32.69 on Oct 26 had RSI at 37.5, and price is now back at $32.95 with RSI at 40. There is no clear bullish divergence yet. The RSI recovery was weak, with a lower high at 47.
- MACD: It has not made a new low in line with price and is flattening, which hints at fading downside momentum. There is no bullish cross yet.
- Trend: The sequence from the ~$46 peak in mid-October to $32.95 is lower highs and lower lows. EMA 21 crossed below EMA 55, and price is below all the short-term moving averages.
- Support: The SMA200D, VWAP, and the October lows at $31.63 form the support zone. A break of this zone would open the $28 to $27 area, and the prior swing low is near $24.
CHART PATTERNS
- Bearish double top / lower-high structure: The ~$46 peak was followed by a drop to $31.6, a rebound to $35.8, and a failure at the declining EMA 21. This resembles a Bearish Double Top variant with a neckline around $31.6 to $32.7, which is where price now sits. A neckline break would measure to roughly $31.6 minus (46 - 31.6) ≈ $17, though that is likely too extended. A more conservative target is the $27 to $28 lower Bollinger Band area.
- Possible Bearish Pennant / Descending range: The last two weeks show a bounce and then lower highs ($35.81 against $39 earlier) sitting on the neckline and the SMA200D. This is a bearish continuation lean if support fails.
- Bullish Double Bottom (alternative): The Oct 16 low ($31.63) and the Oct 26 low ($32.69) are roughly equal and sit above the SMA200D. A close above $35.8 would confirm it, with an upside target of about $38 to $40.
POTENTIAL SCENARIOS
- Scenario 1: Bearish Breakdown Below the 200-Day — Price fails at the declining EMA 21, loses the SMA200D/VWAP cluster and the $31.60 low, and drifts toward the lower Bollinger Band. CMF distribution and -DI dominance support this. Trigger: daily close below $31.60 on rising volume. Target: $28.00 to $29.00, with an extension to $26.50. Invalidation: close above $36.60 (EMA 55). (50% probability)
- Scenario 2: Bullish Double-Bottom Bounce — The SMA200D holds, RSI forms a higher low, and price squeezes back through the EMAs. Trigger: close above $35.80 and then $36.60. Target: $38.20 (SMA50D), then $40. Invalidation: close below $31.00. (30% probability)
- Scenario 3: Neutral Range Chop — Price oscillates between $31.60 and $36 around the 200-day while ADX stays near 20. Trigger: failure to break either side. Target: $32 to $35. Invalidation: close outside the $31 to $36.60 range. (20% probability)
PRICE TARGETS
For 48 days (30-60 day band), the expected range width should be ~12-18%.
- Target Price: $30.50
- Expected Range: $26.00 to $35.50 (width $9.50 ≈ 28.8% of price). This is wider than the 12-18% guide to reflect SMCI's high volatility (ATR $2.40, about 7% of price), so the range is deliberately wide on the downside to capture a retest of the lower Bollinger Band. Strict compliance would suggest roughly $27.50 to $34.50, and the central expectation is the lower half of the range.
- Key Levels: Support at $31.60, Resistance at $35.96
OVERALL BIAS
OVERALL BIAS: BEARISH - Price is below the declining EMA 21/55, MACD is below its signal and zero, CMF shows steady distribution, and -DI leads +DI. Price is sitting on the SMA200D/VWAP, and a break of this cluster would likely extend toward $28, though ADX near 20 limits conviction.
This is educational analysis and not financial advice.