QCOM 48-day bearish forecast — Nov 1, 2026
- Bias: Bearish
- Timeframe: 48 days (made Nov 1, 2026, target date Dec 18, 2026)
- Price at analysis: $164.79
- Price target: $160.00
- Expected range: $148.00 – $172.00
- Result: Pending — graded after the close on Dec 18, 2026
Get a free AI analysis of QCOM today
Analysis
TECHNICAL INDICATORS
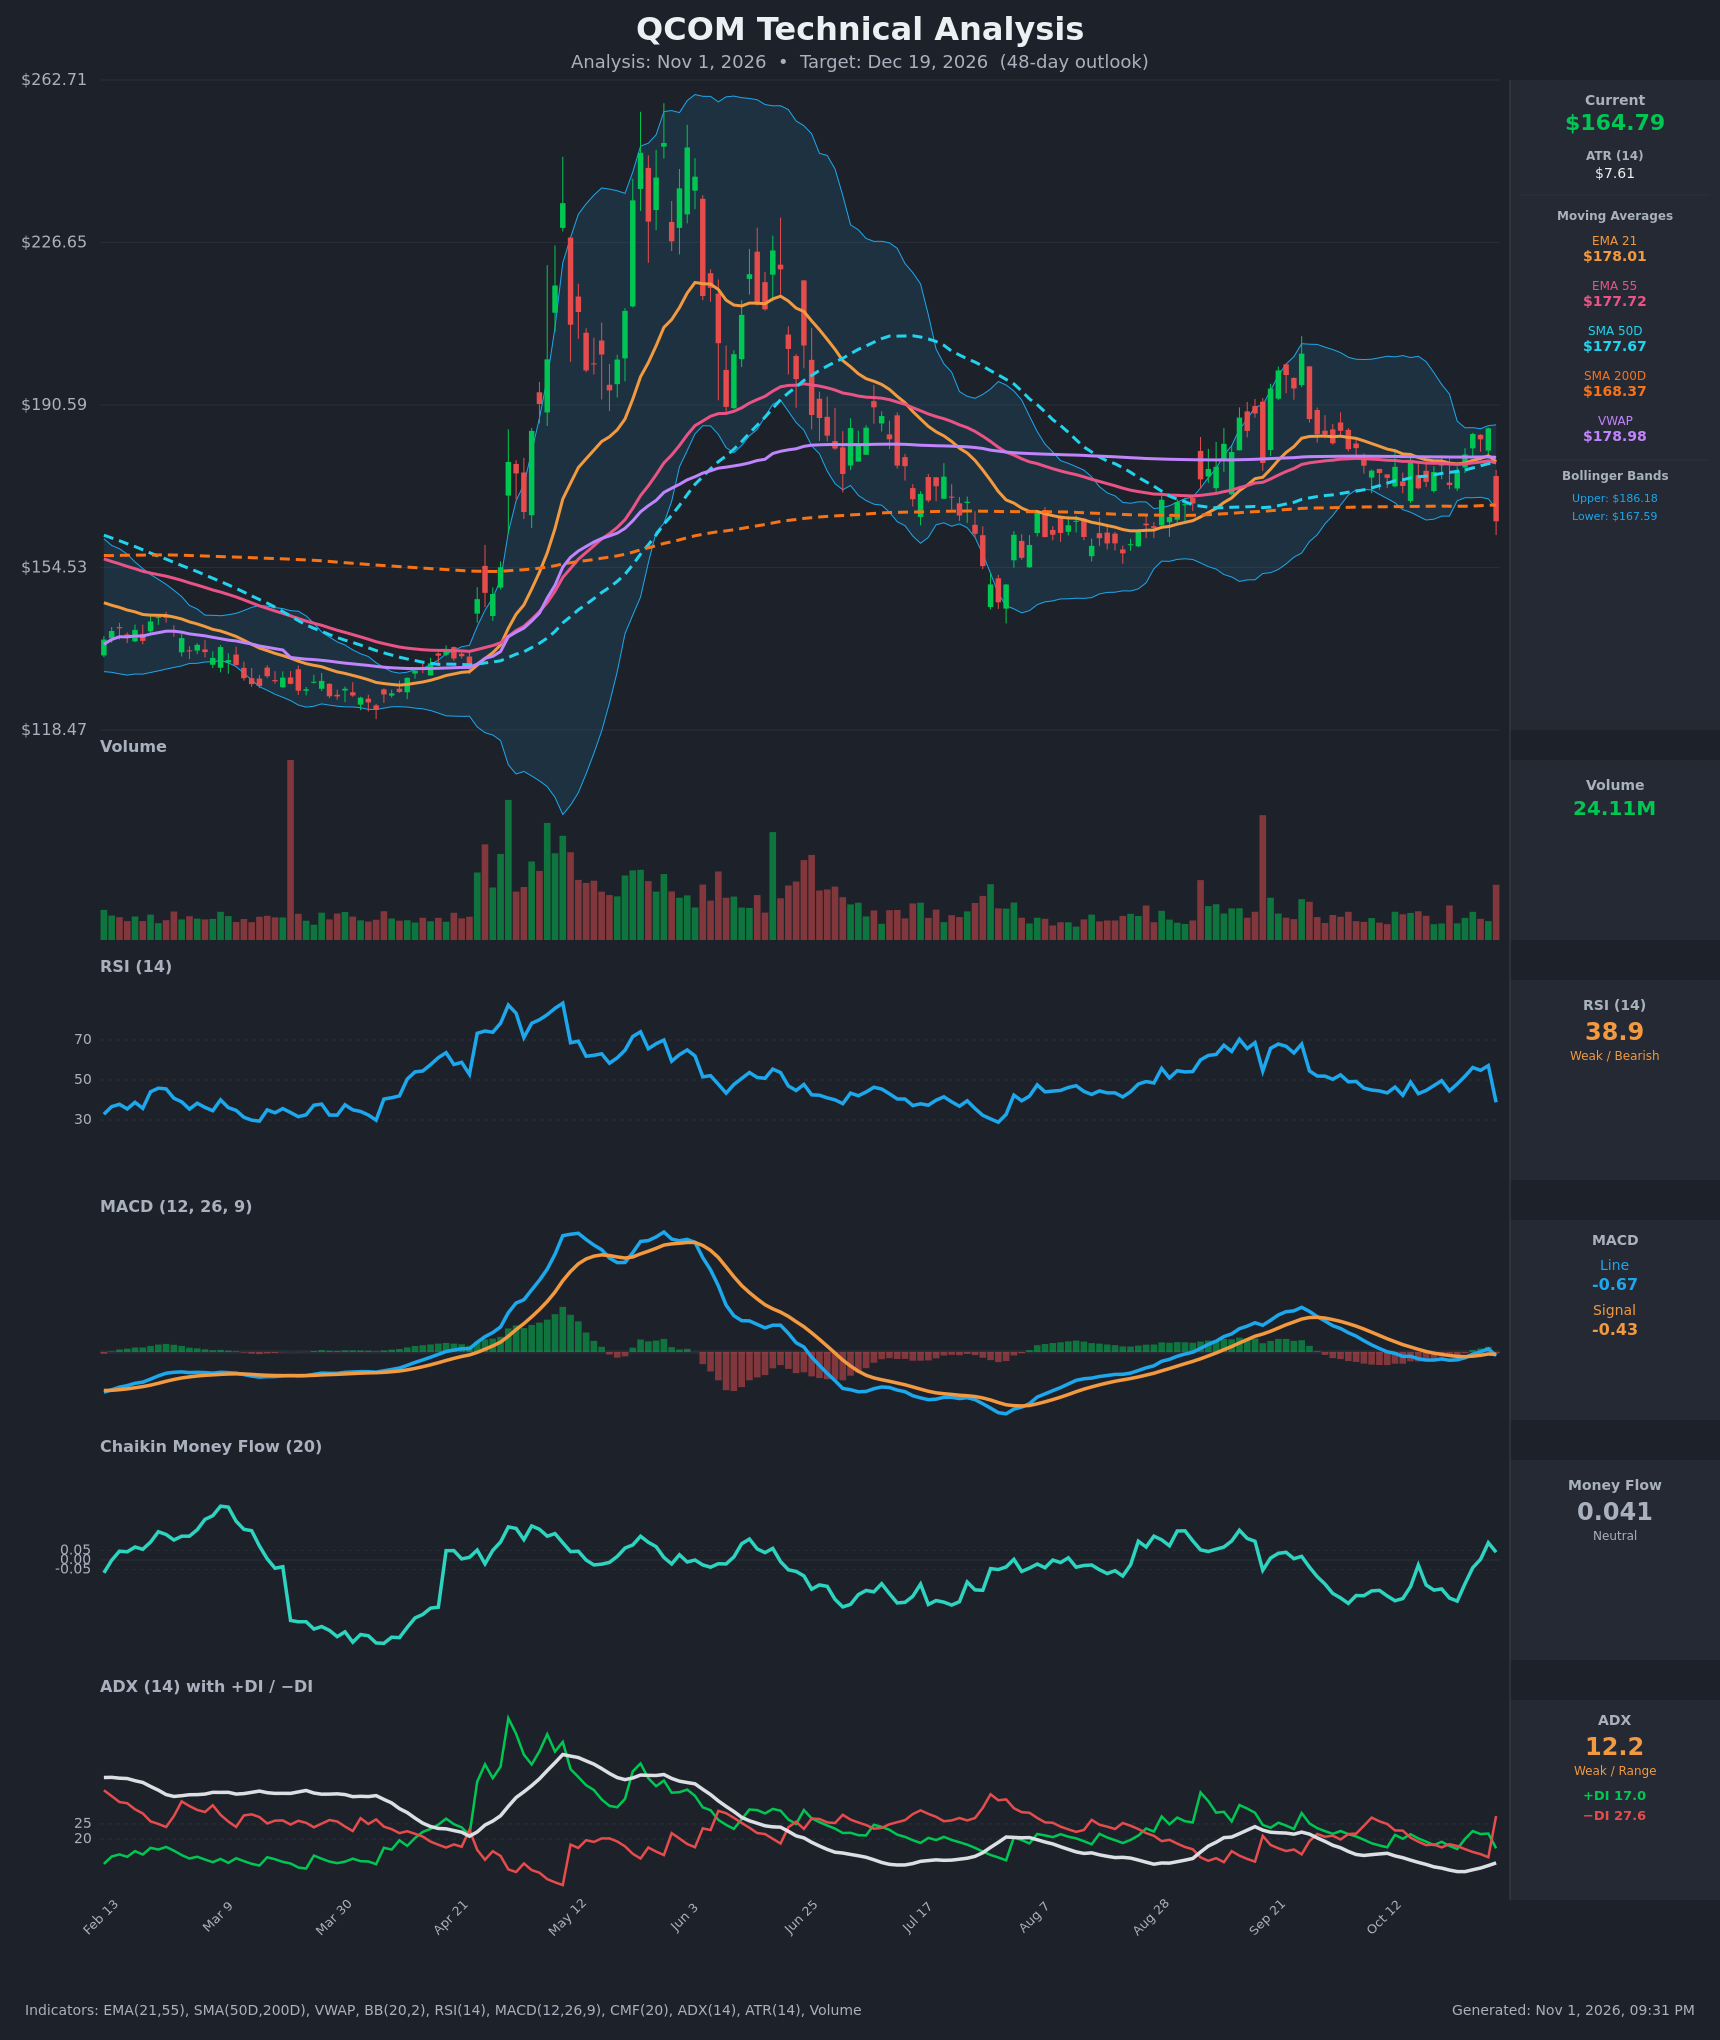
- RSI (14): 38.86, down sharply from 57.2 the previous day (a 18-point drop in one bar). It is approaching oversold (<30) but not there yet, so there is room for further downside. Momentum is turning down. [Bearish]
- 20 EMA (EMA 21): $178.01. Price at $164.79 is about 7.4% below it, and the EMA has just turned lower. EMA21, EMA55 ($177.72), SMA50D ($177.67) and VWAP ($178.98) are all bunched at $178-179, forming a thick overhead resistance zone. [Bearish]
- MACD: Line -0.665 is below Signal -0.428, with a histogram of about -0.24. The line fell from +0.569 to -0.665 in one bar, a fresh bearish crossover that erased the early-week bullish cross. Both lines sit near zero, so the signal is not yet deeply negative. [Bearish]
- Bollinger Bands (20): Price closed at $164.79, below the lower band ($167.59). The upper band is $186.18, and the bands were narrow, so this is a squeeze breakdown. A close outside the band after a squeeze usually signals expansion in the breakout direction, though it also raises the odds of a short-term snapback toward the midline (~$177). [Bearish]
- CMF (20): 0.041, in the neutral band (<+0.05). It was rising from -0.2 to +0.09 before the drop and will probably roll over given the heavy down-volume bar. Accumulation has not been confirmed. [Neutral]
- ADX (14): 12.2, weak and range-bound, but ticking up from 9.3. −DI at 27.6 has jumped above +DI at 17.0 (from 14.0 vs 21.8 a day earlier), a sharp bearish DI crossover. Sellers are in control, but there is no established trend yet. [Weak Trend + Bearish direction]
- Volume: 24.11M, the largest bar in several weeks, on an ~11% down candle. That points to institutional distribution or an event-driven gap-down rather than a drift lower. [Bearish - high-volume breakdown]
DIVERGENCES & TRENDS
- No classic divergence. RSI and MACD confirm the price drop rather than diverge from it.
- The October rally to $185 was a bounce back to the $178 MA cluster, not a breakout. RSI peaked at 57 and failed to reach the 65-70 zone seen in September, so momentum was already weaker at the highs.
- Moving-average convergence: EMA21, EMA55, SMA50D and VWAP are all within about $1 of each other (~$178). This is a coiled, trendless structure that has now resolved lower. There is no recent golden or death cross between SMA50D ($177.67) and SMA200D ($168.37). The 50 is still above the 200, but price has now closed below both.
- Price vs SMA200D: Price is below $168.37 for the first time in this stretch (it held above it in the Aug-Oct dips). A failed retest of this level from below would confirm resistance.
- MACD: A bullish cross on Oct 28-29 reversed within two bars, a failed signal.
- DI crossover: −DI crossed back above +DI and spiked, a bearish control shift. ADX is still below 20, so trend-following signals carry less weight.
CHART PATTERNS
- Rectangle / Bearish Triple Top-style range breakdown: Since September, price has been capped near $185 (Oct 27-29 highs) with the $172-$178 area as the floor. The close at $164.79 breaks below that floor on heavy volume. The measured move (range height ~$13-14) projects to roughly $158-$160.
- Symmetrical triangle-like convergence of MAs: The tightening MAs and Bollinger squeeze resolved to the downside, a continuation of the larger decline from the $250 peak.
- Context: The long-term structure is a lower high ($200 in Sept) after the $255 blow-off top. Prior support sits at $155 (Aug-Sep lows) and $145 (July low).
- A bullish counter-view is a possible double-bottom or range retest around $155, but nothing is formed yet.
POTENTIAL SCENARIOS
- Scenario 1: Bearish Post-Gap Continuation — The high-volume breakdown below the range floor, the bearish MACD and DI crossovers, and price below all MAs lead to follow-through selling and a test of the August-September support zone. Rallies stall at the broken-support / SMA200D area. Trigger: failure to reclaim $168.37 and daily closes below $162. Target: $155-$158, with an extension to $150 if $155 fails. Invalidation: daily close above $172 (the gap-down zone). (45% probability)
- Scenario 2: Bullish Oversold Rebound / Gap Fill — The ~11% one-day drop and the close below the lower Bollinger Band trigger a mean-reversion bounce toward the $178 MA cluster. CMF is still non-negative and RSI is near 39. Trigger: reclaim of $168.37-$170 on rising volume. Target: $174-$178. Invalidation: close below $160. (35% probability)
- Scenario 3: Neutral Post-Shock Base — Price stabilizes and chops between $155 and $172 as the market digests the move, with weak ADX supporting range trade. Trigger: multiple closes inside $158-$170 with fading volume. Target: $160-$168. Invalidation: a close outside $154-$174. (20% probability)
PRICE TARGETS
For the 48-day horizon (target date Dec 19, 2026), the 48-day range width should be ~12-18% of price, so ~$20-$30. Range $148.00 to $172.00 = $24.00 width = 14.6% of $164.79, which fits the guidance.
- Target Price: $160.00 (about 2.9% below current)
- Expected Range: $148.00 to $172.00
- Key Levels: Support at $155.00, Resistance at $168.37 (SMA200D, with the heavier $178 MA cluster above it)
OVERALL BIAS
OVERALL BIAS: BEARISH - Price broke down on heavy volume below the Bollinger lower band, all major moving averages and the prior range floor, with a bearish MACD cross and −DI dominance. Weak ADX and a possible oversold bounce keep conviction modest, with $155 as the first major support.
This is educational analysis and not financial advice.