QQQ 48-day bearish forecast — Nov 1, 2026
- Bias: Bearish
- Timeframe: 48 days (made Nov 1, 2026, target date Dec 18, 2026)
- Price at analysis: $690.49
- Price target: $672.00
- Expected range: $628.00 – $732.00
- Result: Pending — graded after the close on Dec 18, 2026
Get a free AI analysis of QQQ today
Analysis
TECHNICAL INDICATORS
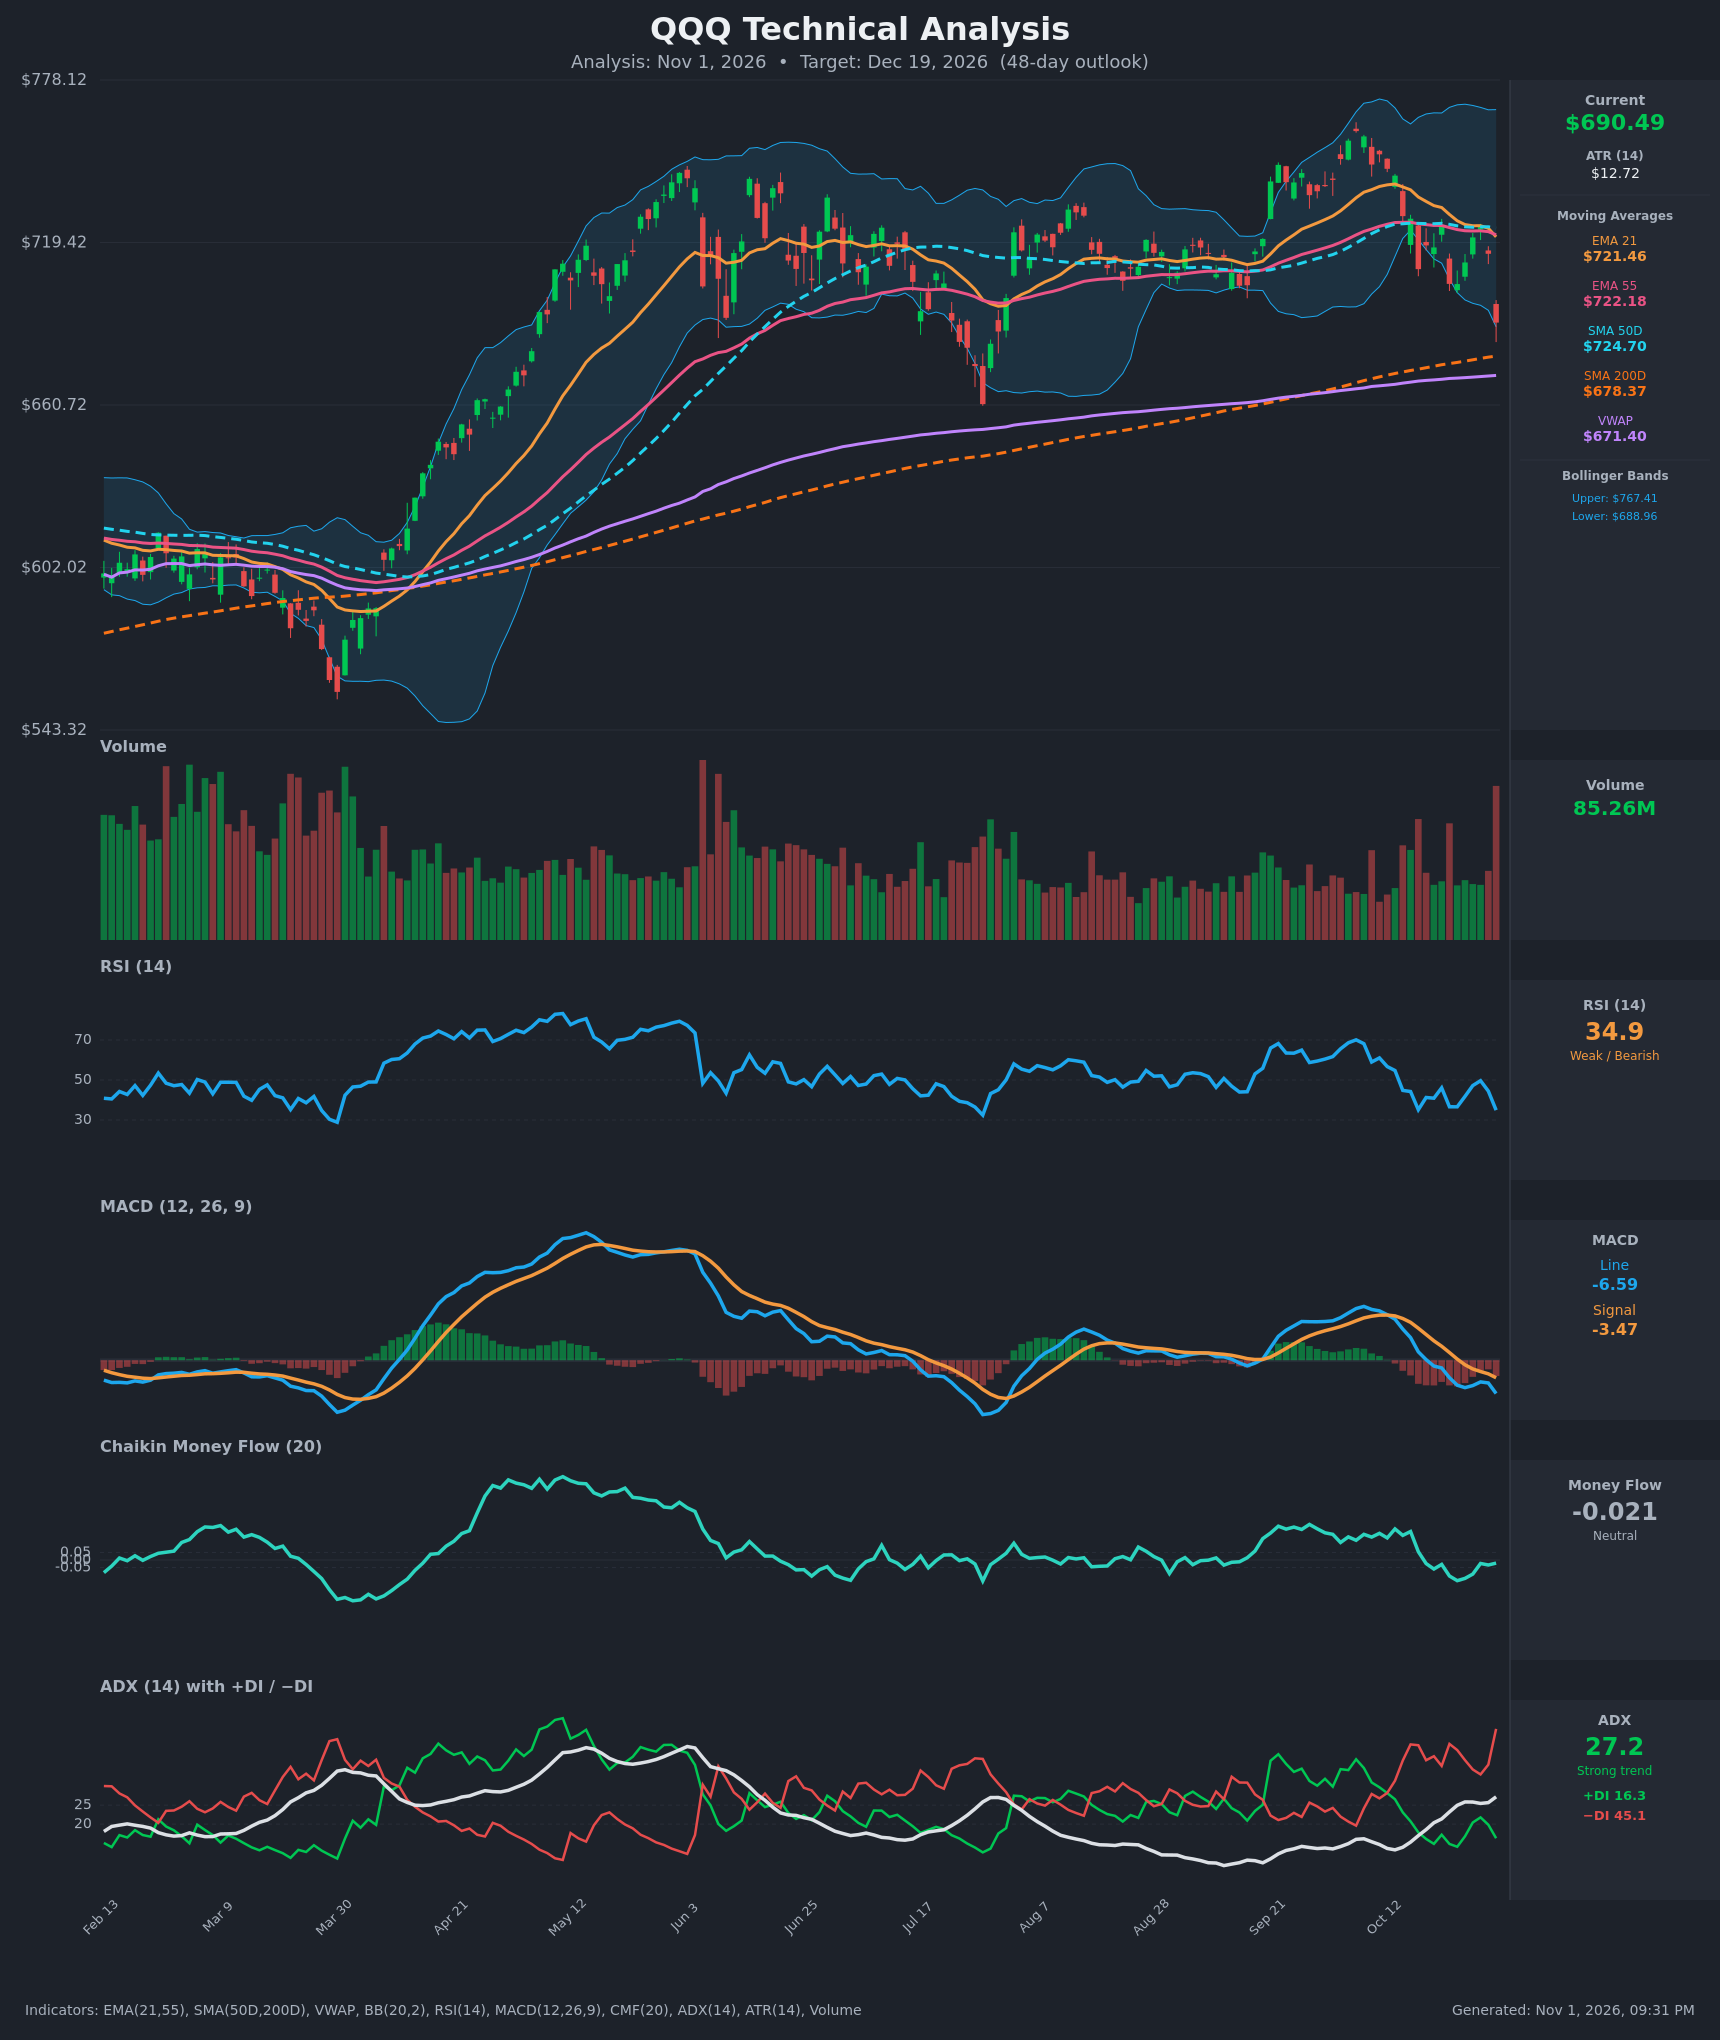
- RSI (14): 34.93, down from 49.6 on Oct 28 and approaching oversold (<30) without reaching it. The last two weeks show lower highs (56.7, then 49.6) and now a new low. Momentum is clearly bearish, with room to fall before an oversold reading. [Bearish]
- 20 EMA: The 21 EMA is $721.46 and price is $690.49, about 4.3% below it. The EMA21 has also crossed below the EMA55 ($722.18) on the latest bar. The cluster at $721-$725 (EMA21, EMA55, SMA50D) is now overhead resistance. [Bearish]
- MACD: Line -6.59 is below signal -3.47, and the histogram is negative and widening. The bearish crossover happened around Oct 19-20 and the line has since gone below zero. The gap is widening on this bar, so downside momentum is accelerating. [Bearish]
- Bollinger Bands (20): Upper $767.41, lower $688.96. Price at $690.49 sits just above the lower band after a roughly 3.5% one-day drop. The bands are wide, so volatility is elevated. Price has moved from the upper half of the bands to the lower band in two weeks. A close below the lower band signals continuation, but a touch of the band can also produce a bounce. [Bearish]
- CMF (20): -0.021, within the ±0.05 neutral zone. It has slipped from +0.2 in mid-October to slightly negative, which shows buying pressure fading. It has not yet confirmed heavy distribution. [Neutral]
- ADX (14): 27.2 and rising, with -DI at 45.1 far above +DI at 16.3. This is a strong, bearish-directed trend. The -DI/+DI spread is the widest in the data shown. [Strong Trend – Bearish]
- Volume: 85.26M on the latest red candle, the largest bar on the chart in many months. A heavy-volume breakdown through the $700-$704 floor of the recent range is typically a distribution or capitulation signature. It leans bearish unless the next sessions fail to follow through. [Bearish – heavy-volume selling]
DIVERGENCES & TRENDS
- There is no bullish RSI or MACD divergence. Price made new lows at $690.49 and RSI and MACD made new lows with it, so momentum confirms price.
- Between Sep 21 and Oct 12, price reached a high near $755-$760 while RSI peaked near 70, then rolled over. The MACD histogram turned negative on Oct 19-20. This was a bearish momentum shift that preceded the breakdown.
- The EMA21 crossed below the EMA55 on Oct 30 ($721.46 vs $722.18), which is a bearish crossover. The EMA21 is also now below the SMA50D ($724.70).
- The SMA50D ($724.70) is still above the SMA200D ($678.37), so there is no death cross. The long-term uptrend is intact but being tested. The gap is about 6.8%, and the SMA200D is rising slowly.
- Price is above the SMA200D by only 1.8% and above VWAP ($671.40) by 2.8%. These are the next major supports.
- ADX rose from 13 to 27 over the last 15 bars while -DI dominated, which is a trend-initiation signature to the downside.
CHART PATTERNS
- Bearish Rectangle / Triple Top–style breakdown (reversal): Price spent June to October between about $700 and $740, with the Sep-Oct rally failing near $755-$760. The close at $690.49 breaks the range floor (about $704) on heavy volume. The measured move is the range height of about $35-$40 projected down from $704, which gives roughly $665-$670. That lines up with the VWAP at $671.40 and the July swing low near $662.
- Bearish Rounded/Double-Top structure: The late-Sep to mid-Oct peak followed by lower highs on RSI is a classic distribution top. Confirmation comes with a sustained break below $704, which has occurred.
- A bullish case would need a reclaim of $704-$722 (a failed breakdown). Price would need to hold the SMA200D and rebuild a base, as in a double bottom, but nothing like that is visible yet.
POTENTIAL SCENARIOS
- Scenario 1: Bearish Breakdown Continuation to SMA200D/VWAP and Beyond — The heavy-volume break below the range floor continues with -DI dominance and negative MACD. Price tests the SMA200D at $678 and VWAP at $671, with the July low near $662 as the measured-move area. Trigger: daily close below $688.96 (the lower Bollinger Band) and then below $678.37. Target: $665-$672. Invalidation: daily close back above $705. (50% probability)
- Scenario 2: Bullish Oversold Relief Rebound — The SMA200D and the rising VWAP hold, RSI rolls up from the mid-30s, and price mean-reverts toward the EMA cluster. Trigger: hold above $678 with a close above $704.40 on rising volume. Target: $720-$725 (EMA21/EMA55/SMA50D cluster). Invalidation: close below $671. (30% probability)
- Scenario 3: Neutral Choppy Base Above the SMA200D — Price oscillates between SMA200D support and the $705 breakdown level while ADX fades. Trigger: repeated holds of $678-$680 with failed rallies at $704-$710. Target: $680-$705. Invalidation: close outside $670-$712. (20% probability)
PRICE TARGETS
Timeframe: 48 days (30-60 day band, so about 12-18% range width).
- Target Price: $672.00
- Expected Range: $628.00 to $732.00 (width $104.00, about 15.1% of current price, which fits the 12-18% guidance for 48 days)
- Key Levels: Support at $678.37 (SMA200D, with VWAP $671.40 and the July low near $662 below), Resistance at $704.40 (recent breakdown level, with the $721-$725 MA cluster above)
OVERALL BIAS
OVERALL BIAS: BEARISH - The latest bar broke the multi-month range floor on the heaviest volume in months, with -DI at 45 vs +DI at 16 and ADX at 27 and rising. The MACD is below signal and zero, the EMA21 has crossed under the EMA55, and the $721-$725 cluster is now resistance. The SMA200D at $678 and VWAP at $671 are the key supports to watch, and the target of $672 sits there.
This is educational analysis and not financial advice.