TLT 48-day bullish forecast — Nov 1, 2026
- Bias: Bullish
- Timeframe: 48 days (made Nov 1, 2026, target date Dec 18, 2026)
- Price at analysis: $81.84
- Price target: $83.40
- Expected range: $76.50 – $88.00
- Result: Pending — graded after the close on Dec 18, 2026
Get a free AI analysis of TLT today
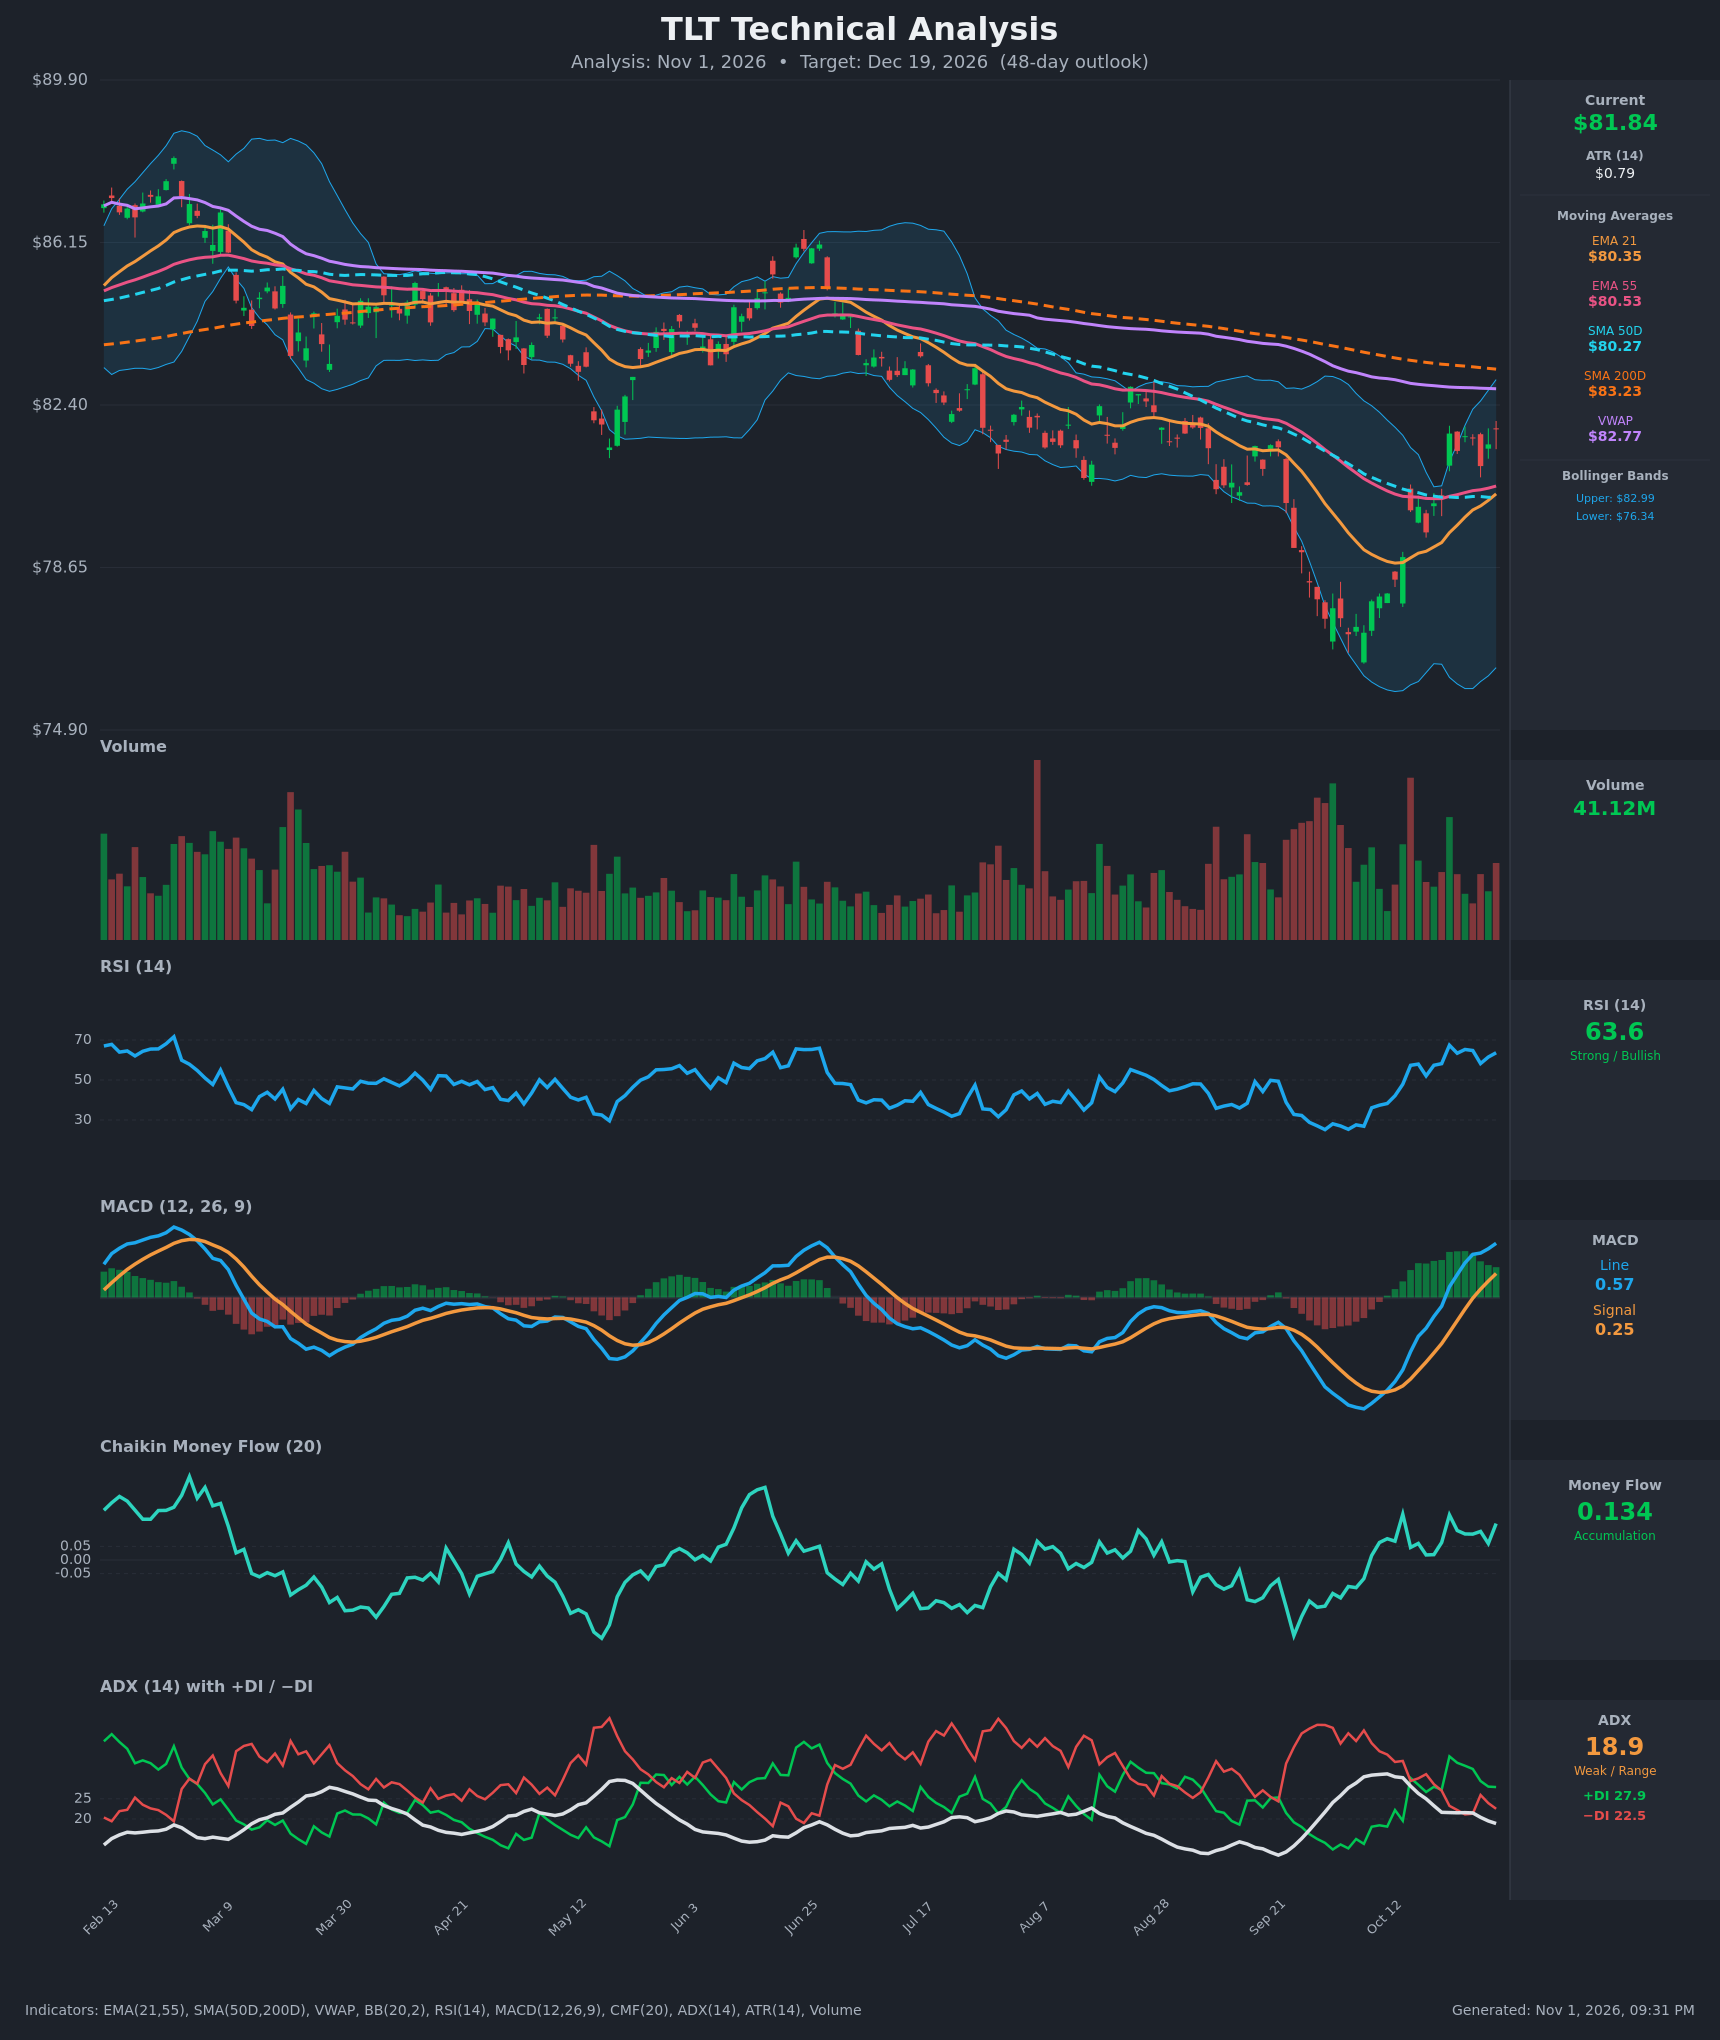
Analysis
TECHNICAL INDICATORS
- RSI (14): 63.63, up from 38 on Oct 12, with a spike to 67.4 on Oct 22. It is in bullish territory but not yet overbought (>70). It has held 58-67 for two weeks, so momentum is positive but flattening. [Bullish]
- 20 EMA (EMA 21 = $80.35): Price at $81.84 is about 1.9% above the EMA, which has turned up from $78.75 and acts as dynamic support. EMA21 is still just under EMA55 ($80.53) and converging, so a bullish EMA cross is likely within days. [Bullish]
- MACD: Line 0.571 is above signal 0.252 and above zero. The bullish crossover happened around Oct 21-22 and the gap is still widening, with a positive, expanding histogram. [Bullish]
- Bollinger Bands (20): Upper $82.99, lower $76.34, midline about $79.66. Price is in the upper half, about $1.15 below the upper band. The bands are wide after the September sell-off and starting to contract, which suggests volatility is normalizing. The upper band is close to SMA200 and VWAP, so the resistance cluster is concentrated at $82.8-83.2. [Bullish]
- CMF (20): 0.134, well above +0.05, and positive for most of the recent bars (0.05-0.17). That is steady accumulation and supports the bounce. [Accumulation]
- ADX (14): 18.9 and falling from 31 in mid-October, which is weak and range-like. +DI (27.9) is above −DI (22.5) after a bullish DI crossover on Oct 15 and again on Oct 22. Direction favors bulls but trend strength is low, so a clean trend is not yet established. [Weak Trend + Bullish lean]
- Volume: 41.12M, roughly average. The Oct 22 breakout bar had solid volume, and the recent pullback days carried lighter volume. The big capitulation volumes of Sep-Oct are behind us, so selling pressure has faded. Participation is adequate but not decisive. [Neutral to mildly Bullish]
DIVERGENCES & TRENDS
- Moving averages: Price is above EMA21, EMA55 and SMA50 ($80.27) but still below SMA200 ($83.23) and VWAP ($82.77). SMA50 is below SMA200, so a death cross is already in place and the long-term trend remains down. SMA200 is still declining.
- Momentum: RSI and MACD both climbed with price from the early-October low near $76.5, with no bearish divergence. RSI made a higher high on Oct 22 and is holding its level. CMF is also confirming.
- Trend strength: The ADX decline from 31 to 19 means the prior down-trend has ended, but the new up-trend has not yet gained strength.
- Crossovers:
- MACD bullish cross is complete.
- DI bullish cross is complete.
- EMA21 is about to cross above EMA55.
- There is no golden cross, and SMA50 is far from SMA200.
- Structure: The year-long sequence of lower highs and lower lows is intact until price closes above the $83-84 zone. The recent low is a V-shaped bounce rather than a base.
CHART PATTERNS
- Bullish falling wedge / descending channel (reversal): Price has traced a year-long falling channel with a V-shaped low near $76.5. Reclaiming the EMAs and SMA50 resembles a breakout from this structure. Confirmation requires a close above SMA200 and the channel top near $83-84, which would open a measured move toward $85-86.
- Range consolidation (Oct 22 – Oct 30): Price is holding $80-82 in a tight band. This resembles a bullish pennant or flag after the sharp Oct 15-22 advance. A break above $82.8 would project roughly +$3 to about $85.
- Caution: The SMA200, VWAP and upper Bollinger Band all sit at $82.8-83.2. If price fails there, the structure becomes a lower high within the broader downtrend (a bearish continuation setup).
POTENTIAL SCENARIOS
- Scenario 1: Bullish Breakout Above the SMA200 Cluster — Price consolidates above the EMAs, then clears the $82.8-83.2 resistance stack as MACD and CMF stay positive and EMA21 crosses above EMA55. Trigger: daily close above $83.25 on rising volume. Target: $85.00-$86.15. Invalidation: close below $80.25 (SMA50/EMA21). (45% probability)
- Scenario 2: Neutral Range Chop Beneath Resistance — Price stalls at the SMA200/VWAP zone, with ADX staying below 20, and oscillates between the moving-average support and overhead resistance. Trigger: repeated rejections at $82.8-83.2 with no close above. Target: $80.00-$83.00. Invalidation: close above $83.50 or below $79.50. (30% probability)
- Scenario 3: Bearish Rejection at the Long-Term Trend — The rally fades at the declining SMA200, forming a lower high, and price slips below the EMAs and SMA50. Trigger: close below $80.25 with a MACD signal-line cross down. Target: $78.00, then $76.50. Invalidation: close above $83.50. (25% probability)
PRICE TARGETS
- Target Price: $83.40 (48-day horizon, about +1.9% from $81.84)
- Expected Range: $76.50 to $88.00. Width is $11.50, about 14.1% of the current price, which fits the 30-60 day guidance of ~12-18%.
- Key Levels: Support at $80.30 (EMA21/SMA50 confluence), Resistance at $83.23 (SMA200, with VWAP at $82.77 just below)
OVERALL BIAS
OVERALL BIAS: BULLISH - MACD and DI bullish crossovers, RSI at 63.6, CMF accumulation (0.134), and price above the EMAs and SMA50 favor a test and likely break of the $83 SMA200 zone. Conviction is modest because ADX is weak, SMA50 is below SMA200 and the long-term trend is still down, so overhead resistance is a real risk.
This is educational analysis and not financial advice.