TSLA 48-day bullish forecast — Nov 1, 2026
- Bias: Bullish
- Timeframe: 48 days (made Nov 1, 2026, target date Dec 18, 2026)
- Price at analysis: $399.81
- Price target: $416.00
- Expected range: $372.00 – $434.00
- Result: Pending — graded after the close on Dec 18, 2026
Get a free AI analysis of TSLA today
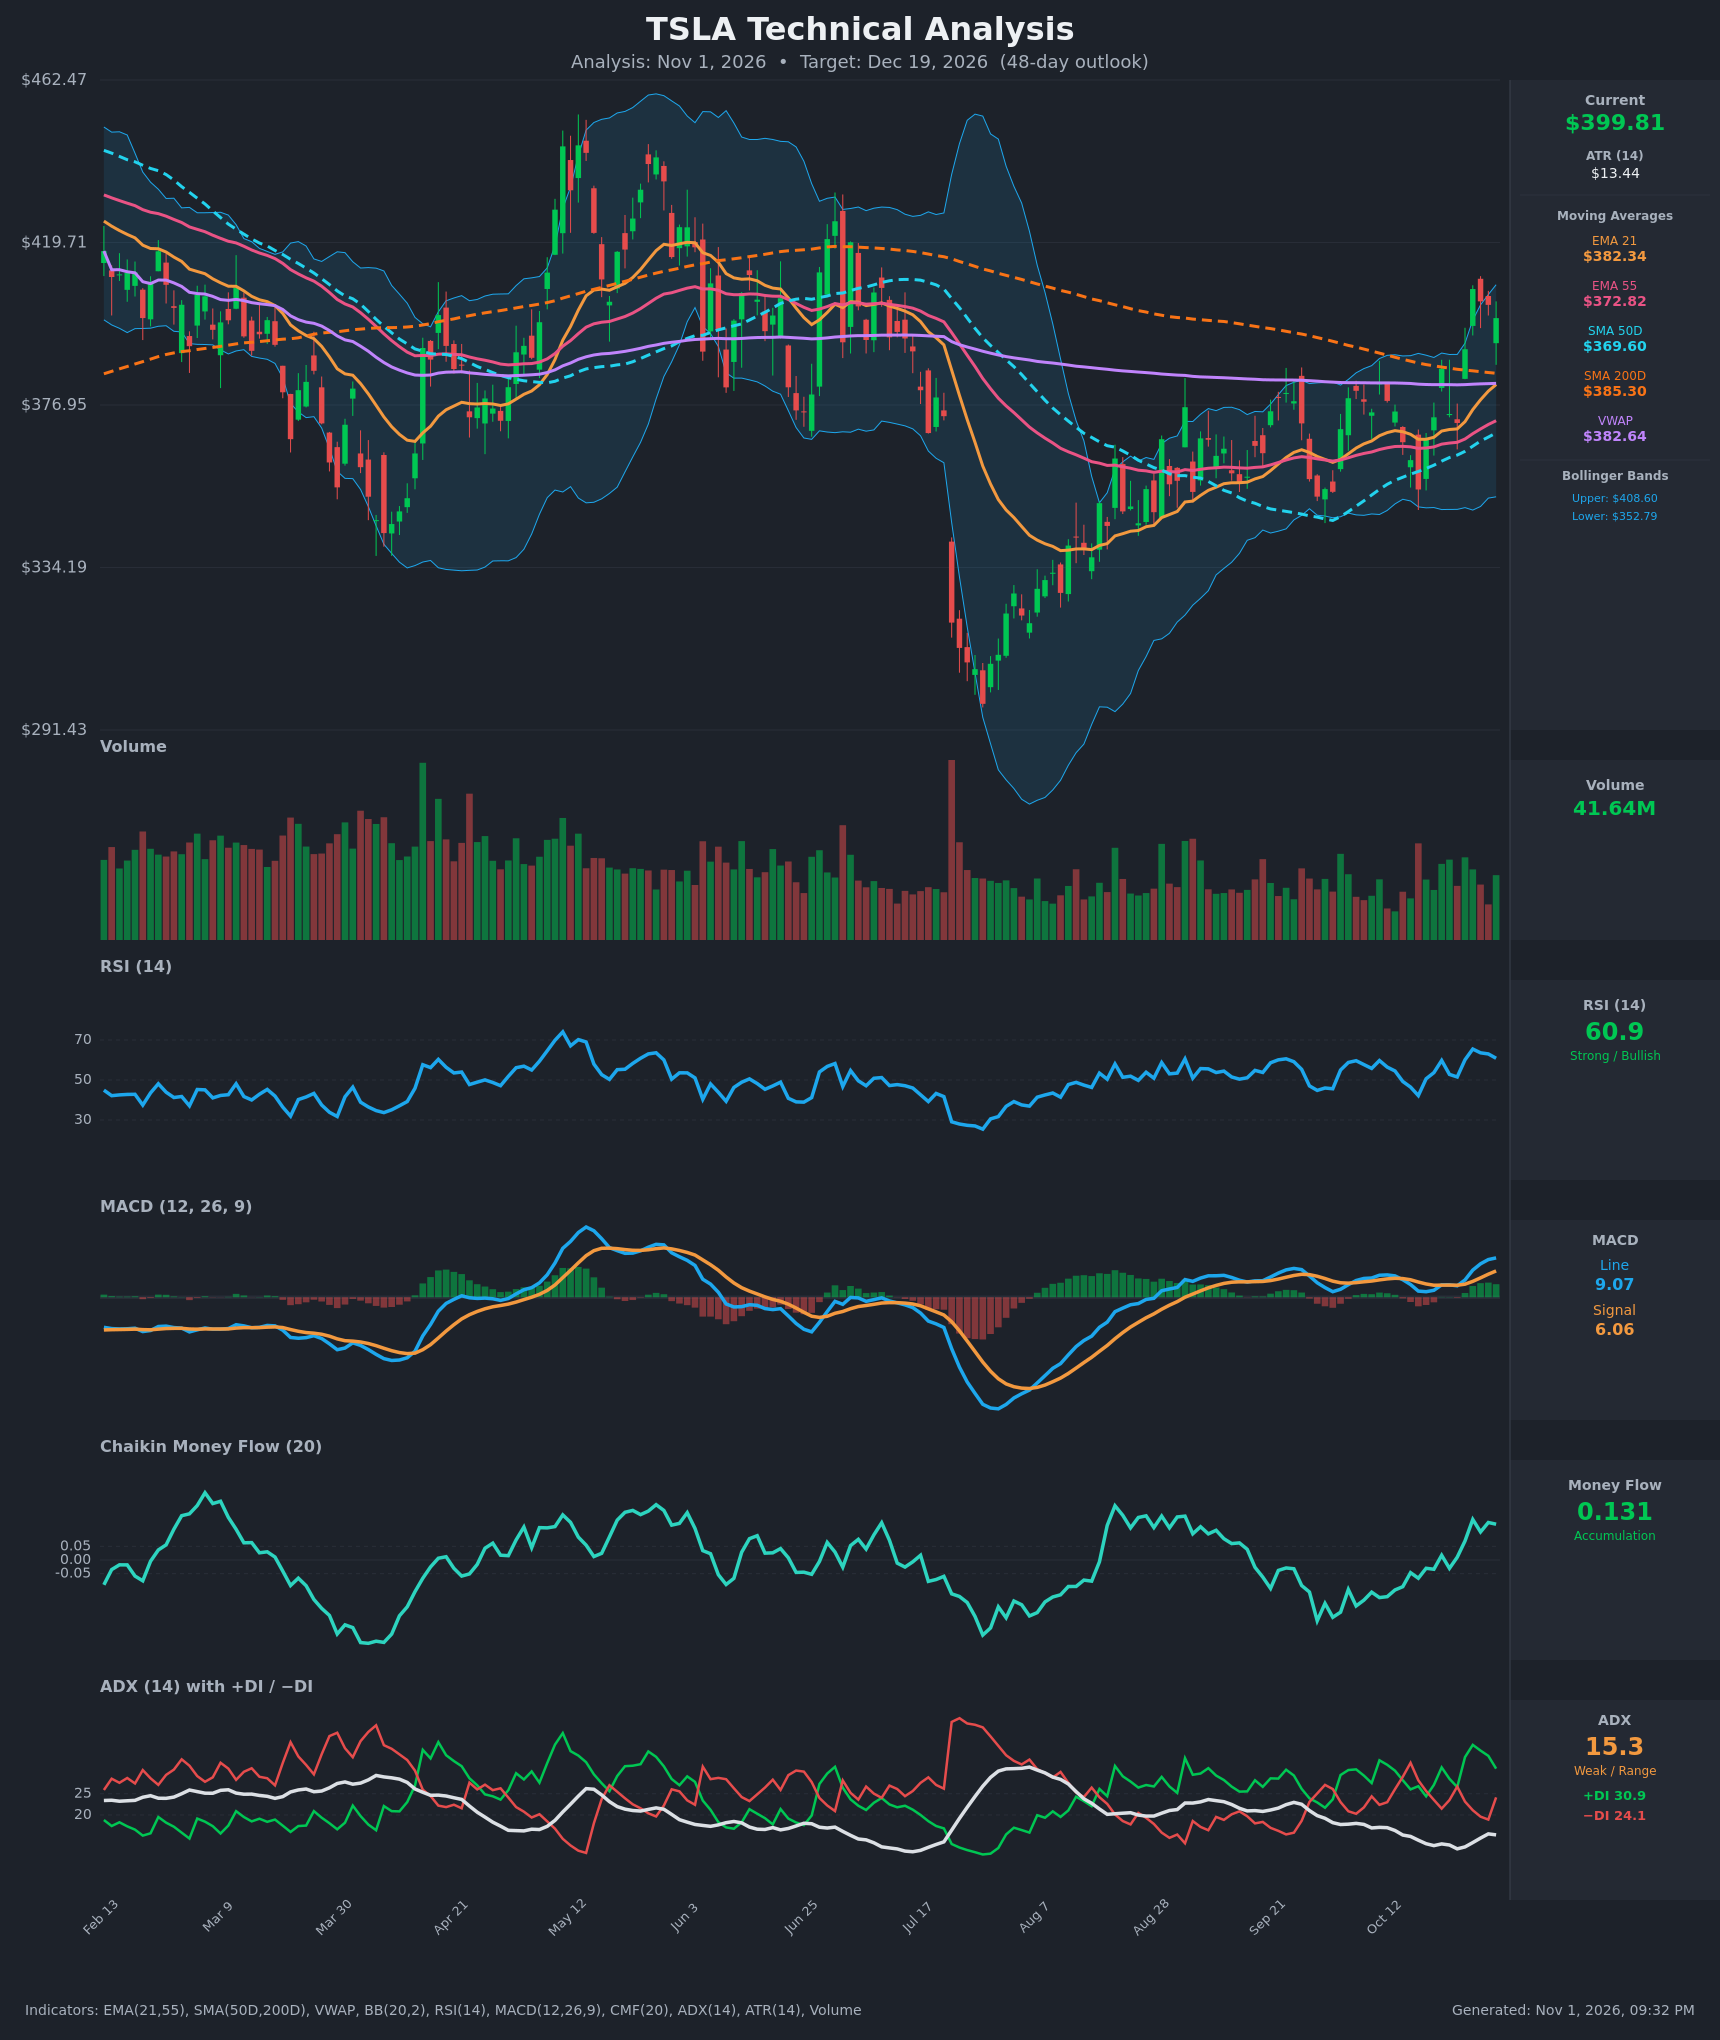
Analysis
TECHNICAL INDICATORS
- RSI (14): 60.86, up from 42.2 on Oct 16 and just off the 65.5 peak on Oct 27. This is strong bullish momentum with room before overbought (70). A small cooling over the last three bars is healthy. [Bullish]
- 20 EMA: The 21 EMA is $382.34 and price ($399.81) is about 4.6% above it, so it acts as dynamic support. EMA21 is also above EMA55 ($372.82), and the gap is widening. [Bullish]
- MACD: Line 9.07 is above Signal 6.06, with a positive, expanding histogram (~+3.0). The bullish crossover happened around Oct 21-22 and the line is making higher highs. [Bullish]
- Bollinger Bands (20): Upper $408.60, lower $352.79, midline ≈$380.70. Price sits at roughly 84% of the band range, in the upper half and near the upper band. Bandwidth is moderate (~14%). The Oct 27 high of $407 was rejected near the upper band, so a short-term pause is possible, but the squeeze has resolved upward. [Bullish]
- CMF (20): 0.131, above the +0.05 threshold and rising from -0.135 on Oct 12. Money has shifted clearly from distribution to accumulation. [Accumulation]
- ADX (14): 15.3 with +DI 30.9 above −DI 24.1. Trend strength is weak (<20), so this is not yet an established trend. The DI spread favors bulls, but +DI has slipped from 36.5 and −DI has bounced from 18.9, so the bullish edge is fading slightly. [Weak Trend, Bullish lean]
- Volume: 41.64M, moderate with no surge. The breakout days on Oct 26-27 carried the best participation, and the pullback has come on lighter volume. That is constructive, but conviction is not exceptional. [Mildly Bullish / Neutral]
Moving-average structure:
- Price is above SMA200D ($385.30), EMA21, EMA55, SMA50D ($369.60) and VWAP ($382.64).
- SMA50D is still below SMA200D (no golden cross yet). The gap is only ~$15.70, and SMA50D is rising while SMA200D is falling, so a golden cross is plausible within the 48-day window.
DIVERGENCES & TRENDS
- Divergences: There is no clear price/RSI or price/MACD divergence. RSI and MACD both confirm the recent higher highs. The only flag is the weak ADX (15.3), which means the move is not yet backed by trend strength.
- Trends: Moving averages are converging and turning up, with price reclaiming the SMA200D. CMF has trended up since September and is now positive. MACD is accelerating.
- Crossovers and breaks:
- Price closed above the SMA200D after months below it, a notable long-term shift.
- The MACD bullish crossover is intact.
- The +DI/−DI relationship flipped back to bullish on Oct 19-21 after a brief bearish stretch.
- A potential golden cross (SMA50D over SMA200D) is approaching.
CHART PATTERNS
- Base breakout resembling an Ascending Triangle / Bullish continuation: From August to October, price made higher lows ($345-$355) against flat resistance in the $380-$385 area (the SMA200D zone). The late-October push through that zone resembles an ascending-triangle breakout. The measured move (height ≈ $35-40 added to ~$385) points to ~$420-$425.
- Broader context: The July low near $300 followed by a steady recovery looks like a rounded bottom. Overhead supply sits near $420-$430 (June highs) and then the $440-$460 spring highs.
- Caveat: The breakout is only a few days old and has already shown one rejection near $407. A retest of $382-$385 is common and healthy.
POTENTIAL SCENARIOS
- Scenario 1: Bullish Breakout Continuation — Price holds above the SMA200D/EMA21 cluster, the SMA50D crosses above the SMA200D, and price rises toward prior supply in the $415-$430 zone. Trigger: a daily close above $408-$410 (upper Bollinger and the Oct 27 high) on rising volume. Target: $415-$430. Invalidation: a daily close below $380. (52% probability)
- Scenario 2: Neutral Range Consolidation — Price digests the rally between the $382 MA cluster and ~$410, with ADX staying below 20. Trigger: failure to break $410 combined with support holding at $382-$385. Target: $385-$410 chop. Invalidation: a close above $412 or below $375. (26% probability)
- Scenario 3: Bearish Failed Breakout — The SMA200D breakout proves a false move and price falls back into the prior $350-$385 range. Trigger: a daily close below $382 (EMA21/VWAP/SMA200 confluence) with MACD rolling over. Target: $365-$370 (SMA50D/EMA55), then $352. Invalidation: a reclaim of $400 on strong volume. (22% probability)
PRICE TARGETS
For the 48-day horizon (target date Dec 19, 2026), I lean modestly bullish.
- Target Price: $416.00
- Expected Range: $372.00 to $434.00 (width $62, about 15.5% of current price, consistent with the 30-60 day guidance of ~12-18%)
- Key Levels: Support at $385.30 (SMA200D, with EMA21 and VWAP just below at ~$382), Resistance at $420.00
OVERALL BIAS
OVERALL BIAS: BULLISH - Price has reclaimed the SMA200D and sits above every moving average, MACD is bullish and expanding, CMF shows accumulation, and RSI is strong without being overbought. The weak ADX (15.3) and the nearby upper Bollinger Band keep conviction modest, so a retest of $382-$385 is likely before higher targets are reached.
This is educational analysis and not financial advice.