WMT 48-day bullish forecast — Nov 1, 2026
- Bias: Bullish
- Timeframe: 48 days (made Nov 1, 2026, target date Dec 18, 2026)
- Price at analysis: $123.51
- Price target: $127.50
- Expected range: $118.50 – $136.00
- Result: Pending — graded after the close on Dec 18, 2026
Get a free AI analysis of WMT today
Analysis
TECHNICAL INDICATORS
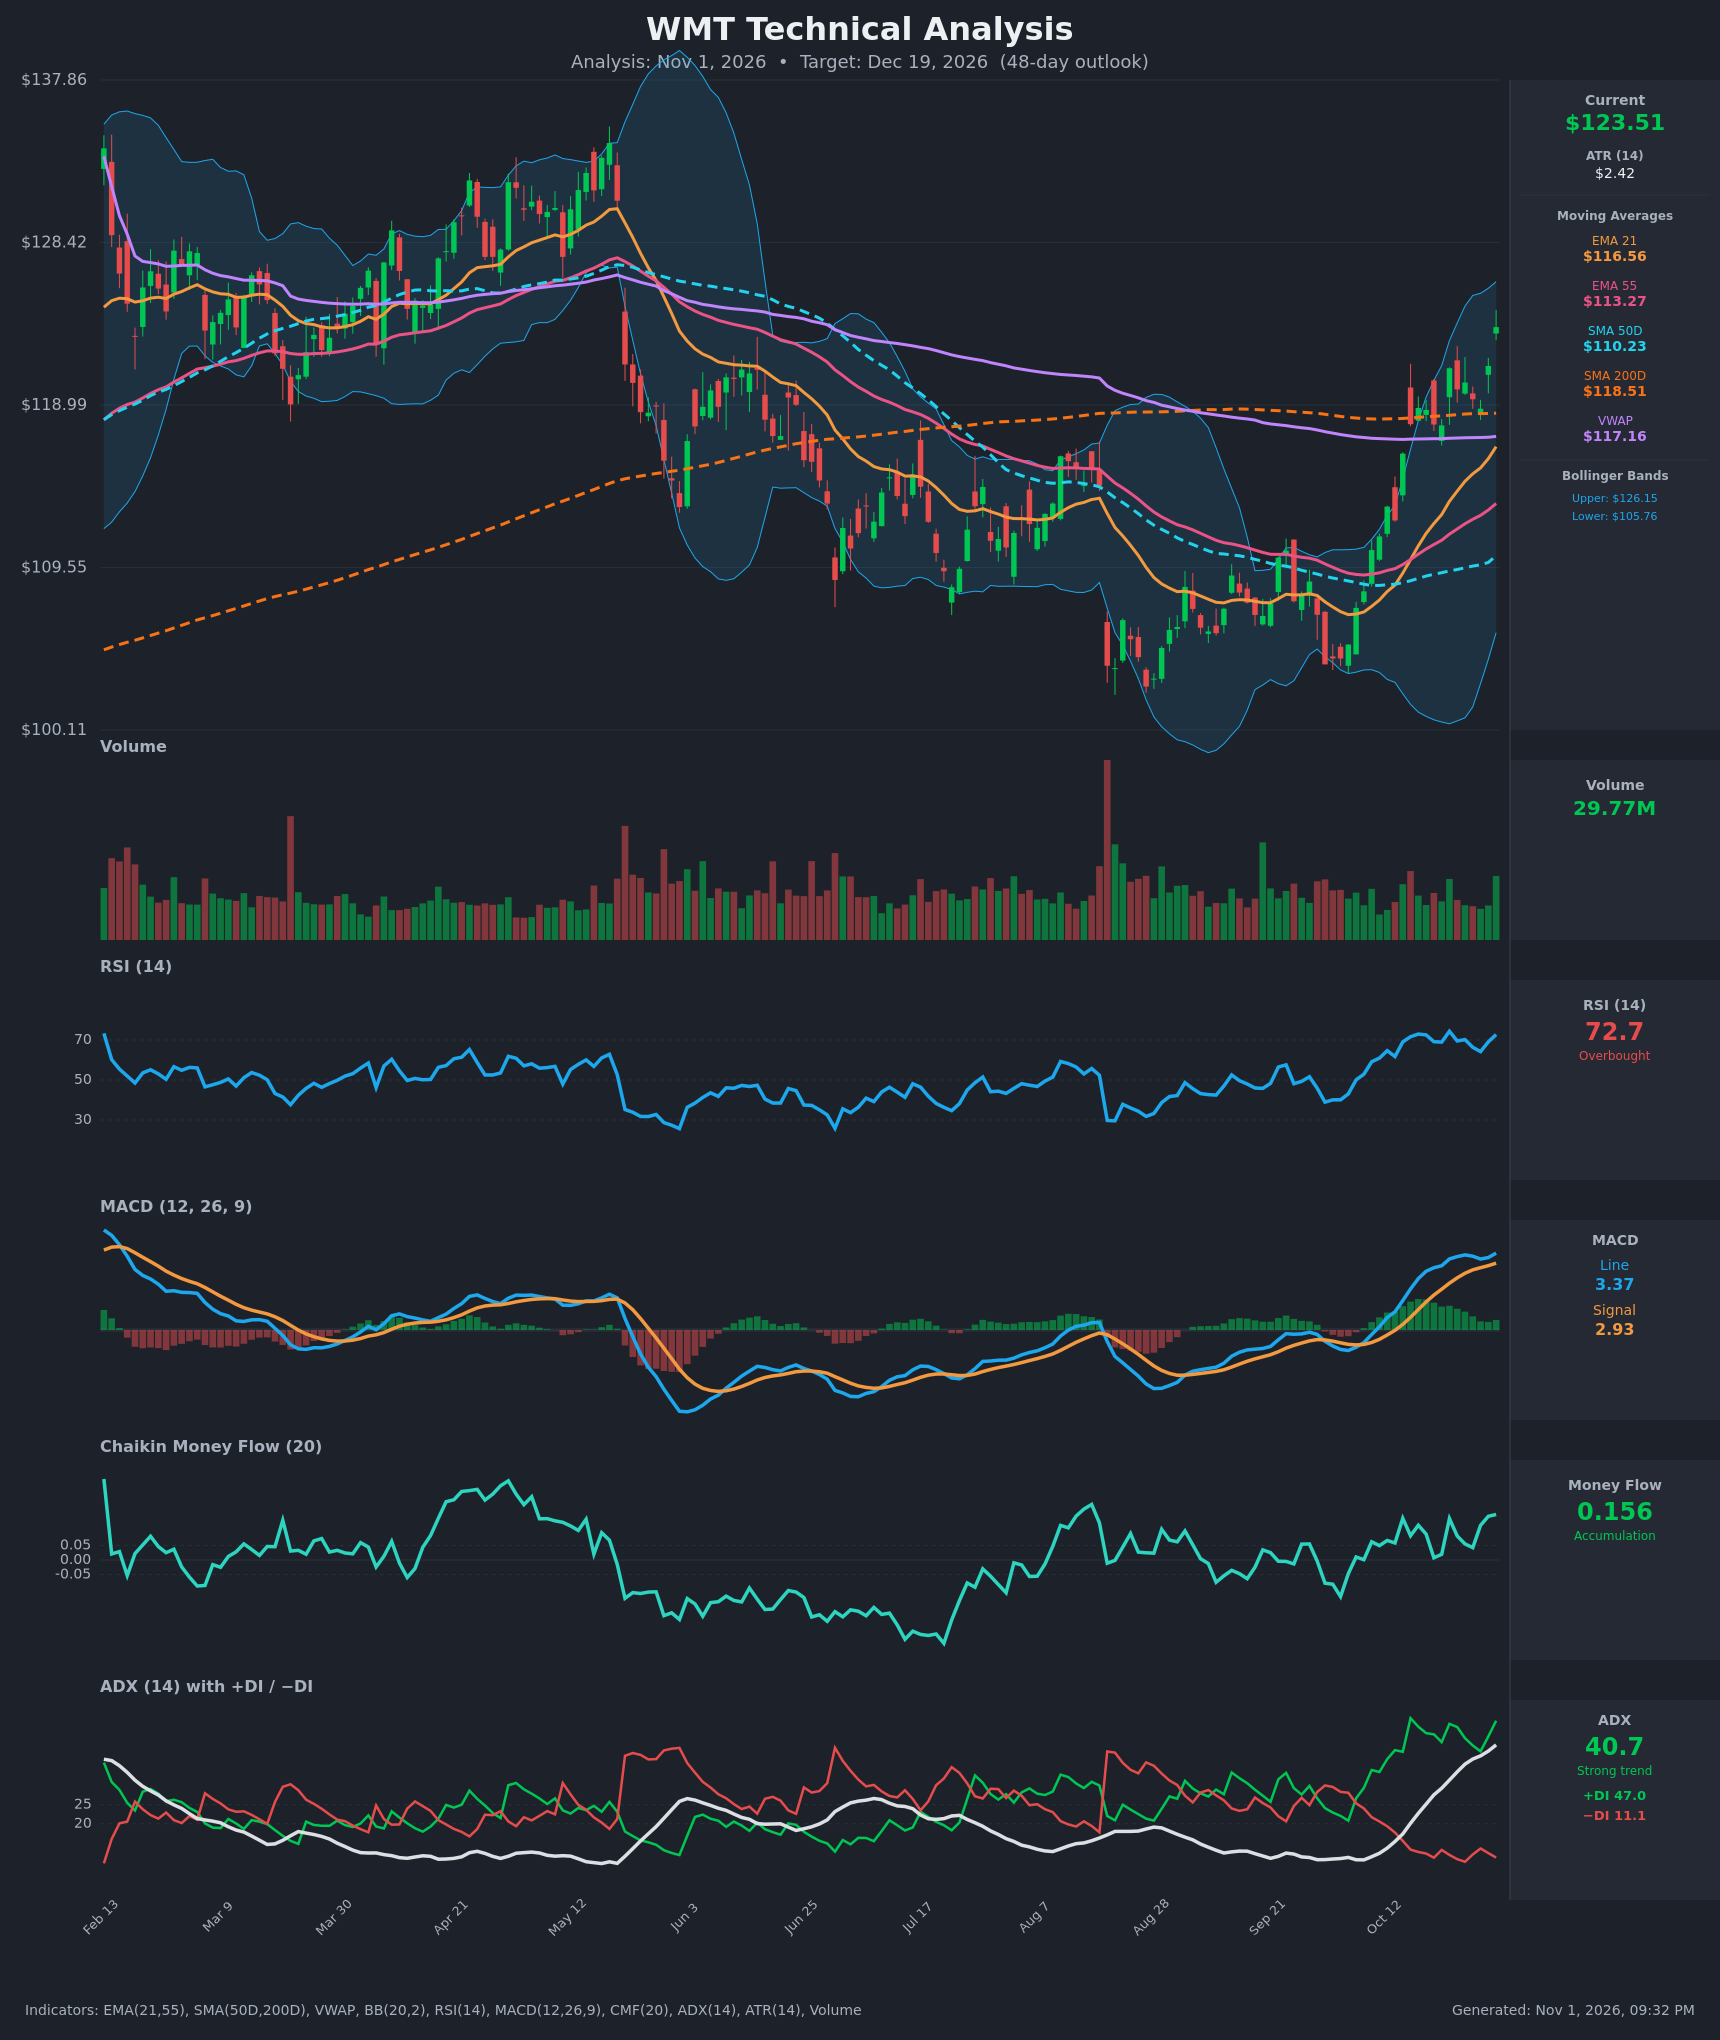
- RSI (14): 72.7, overbought and back above 70 after dipping to 64 on Oct 28. It has held 62-74 for about three weeks, which is typical of a strong trend. The risk is a short-term pause rather than a trend reversal. [Bullish]
- 20 EMA (EMA 21): $116.56, with price about 6% above it. The EMA is rising steeply and crossed above EMA 55 ($113.27) around Oct 15. Price is stretched from the mean, so a pullback toward $116-118 would be normal. [Bullish]
- MACD: The line (3.365) is above the signal (2.926), and both are well above zero. The line has re-accelerated over the last three bars after flattening in late October. The positive histogram is widening again, so momentum is intact. [Bullish]
- Bollinger Bands (20): The upper band is $126.15, the lower $105.76, and the mid-band is about $116. Price at $123.51 sits in the upper quarter of the bands, which have been expanding. A "walk the band" move is possible, but upper-band tags often cause short pauses. [Bullish]
- CMF (20): 0.156, well above +0.05 and positive for most of the last 15 bars (peak around 0.156 today). This is genuine buying pressure behind the rally. [Accumulation]
- ADX (14): 40.7 and rising from 13.6 on Oct 12, with +DI at 47.0 far above −DI at 11.1. This is a very strong uptrend. ADX above 40 can mean the trend is mature, so exhaustion is possible near term. [Strong Trend – Bullish]
- Volume: 29.77M on the latest green candle, above the recent average. Up days carry heavier volume than the pullback days, which supports the breakout. [Bullish confirmation]
DIVERGENCES & TRENDS
- There is no bearish RSI or MACD divergence. Both made higher highs with price, and MACD is making new cycle highs.
- Price is above VWAP ($117.16), EMA 21, EMA 55 and SMA 50D ($110.23). It has also moved above SMA 200D ($118.51), a key long-term level, and held it for several sessions.
- SMA 50D is still below SMA 200D, so no golden cross has occurred. The gap is narrowing quickly ($8.3), and a cross could develop inside the 48-day window if the trend holds.
- The EMA 21/55 bullish crossover on Oct 15 and the MACD crossover on Oct 13 have both been sustained.
- The main caution is extension. RSI is above 70 and price is 6% above EMA 21 and near the upper Bollinger Band. Short-term consolidation or a retest of $118-119 would be healthy.
CHART PATTERNS
- Bullish Double Bottom / base: The August and late-September lows near $103-105 formed a double bottom. The neckline sits around $115-116 and has been broken decisively. The measured move is roughly $12 above the neckline, or about $128.
- Bullish Falling Wedge (reversal): The decline from the May peak to the September lows compressed into a wedge, and the breakout confirms it. The usual target is a retracement toward the wedge's origin, near $128-133, which is the prior range top.
- The main overhead supply zone is $128-133, from the May consolidation highs.
POTENTIAL SCENARIOS
- Scenario 1: Bullish Trend Continuation — The breakout above SMA 200D holds, any pullback is shallow, and buyers retarget the prior consolidation zone. Trigger: a daily close above $126.15 (upper BB) with CMF staying above 0.05. Target: $127.50 to $130 (double bottom measured move and the lower edge of the $128-133 supply zone). Invalidation: a daily close below $118.50 (SMA 200D). (50% probability)
- Scenario 2: Bearish Overbought Pullback — RSI above 70 with price at the upper band triggers profit-taking, and price retests the breakout area. Trigger: a bearish MACD cross or a close below $119 on rising volume. Target: $115-117 (EMA 21 and VWAP), with a deeper test of $113 (EMA 55). Invalidation: a reclaim of $124 with strong volume. (32% probability)
- Scenario 3: Neutral Consolidation — Price digests the rally between SMA 200D and the upper Bollinger Band while the moving averages catch up. Trigger: ADX rolling over from 40 and RSI cooling to 55-60. Target: a $119-$126 range. Invalidation: a close outside that range on volume. (18% probability)
PRICE TARGETS
- Target Price: $127.50 (48-day timeframe)
- Expected Range: $118.50 to $136.00 (width $17.50, about 14.2% of the current price, in line with the 30-60 day guidance)
- Key Levels: Support at $118.50, Resistance at $128.40
OVERALL BIAS
OVERALL BIAS: BULLISH - ADX is at 40.7 with +DI far above −DI, price has reclaimed SMA 200D, EMA 21 is above EMA 55, MACD is positive and CMF shows accumulation. The completed double-bottom/falling-wedge breakout points toward the $128 area. Overbought RSI means a retest of $118-119 is likely along the way.
This is educational analysis and not financial advice.