XLE 48-day bullish forecast — Nov 1, 2026
- Bias: Bullish
- Timeframe: 48 days (made Nov 1, 2026, target date Dec 18, 2026)
- Price at analysis: $70.02
- Price target: $72.00
- Expected range: $65.00 – $75.50
- Result: Pending — graded after the close on Dec 18, 2026
Get a free AI analysis of XLE today
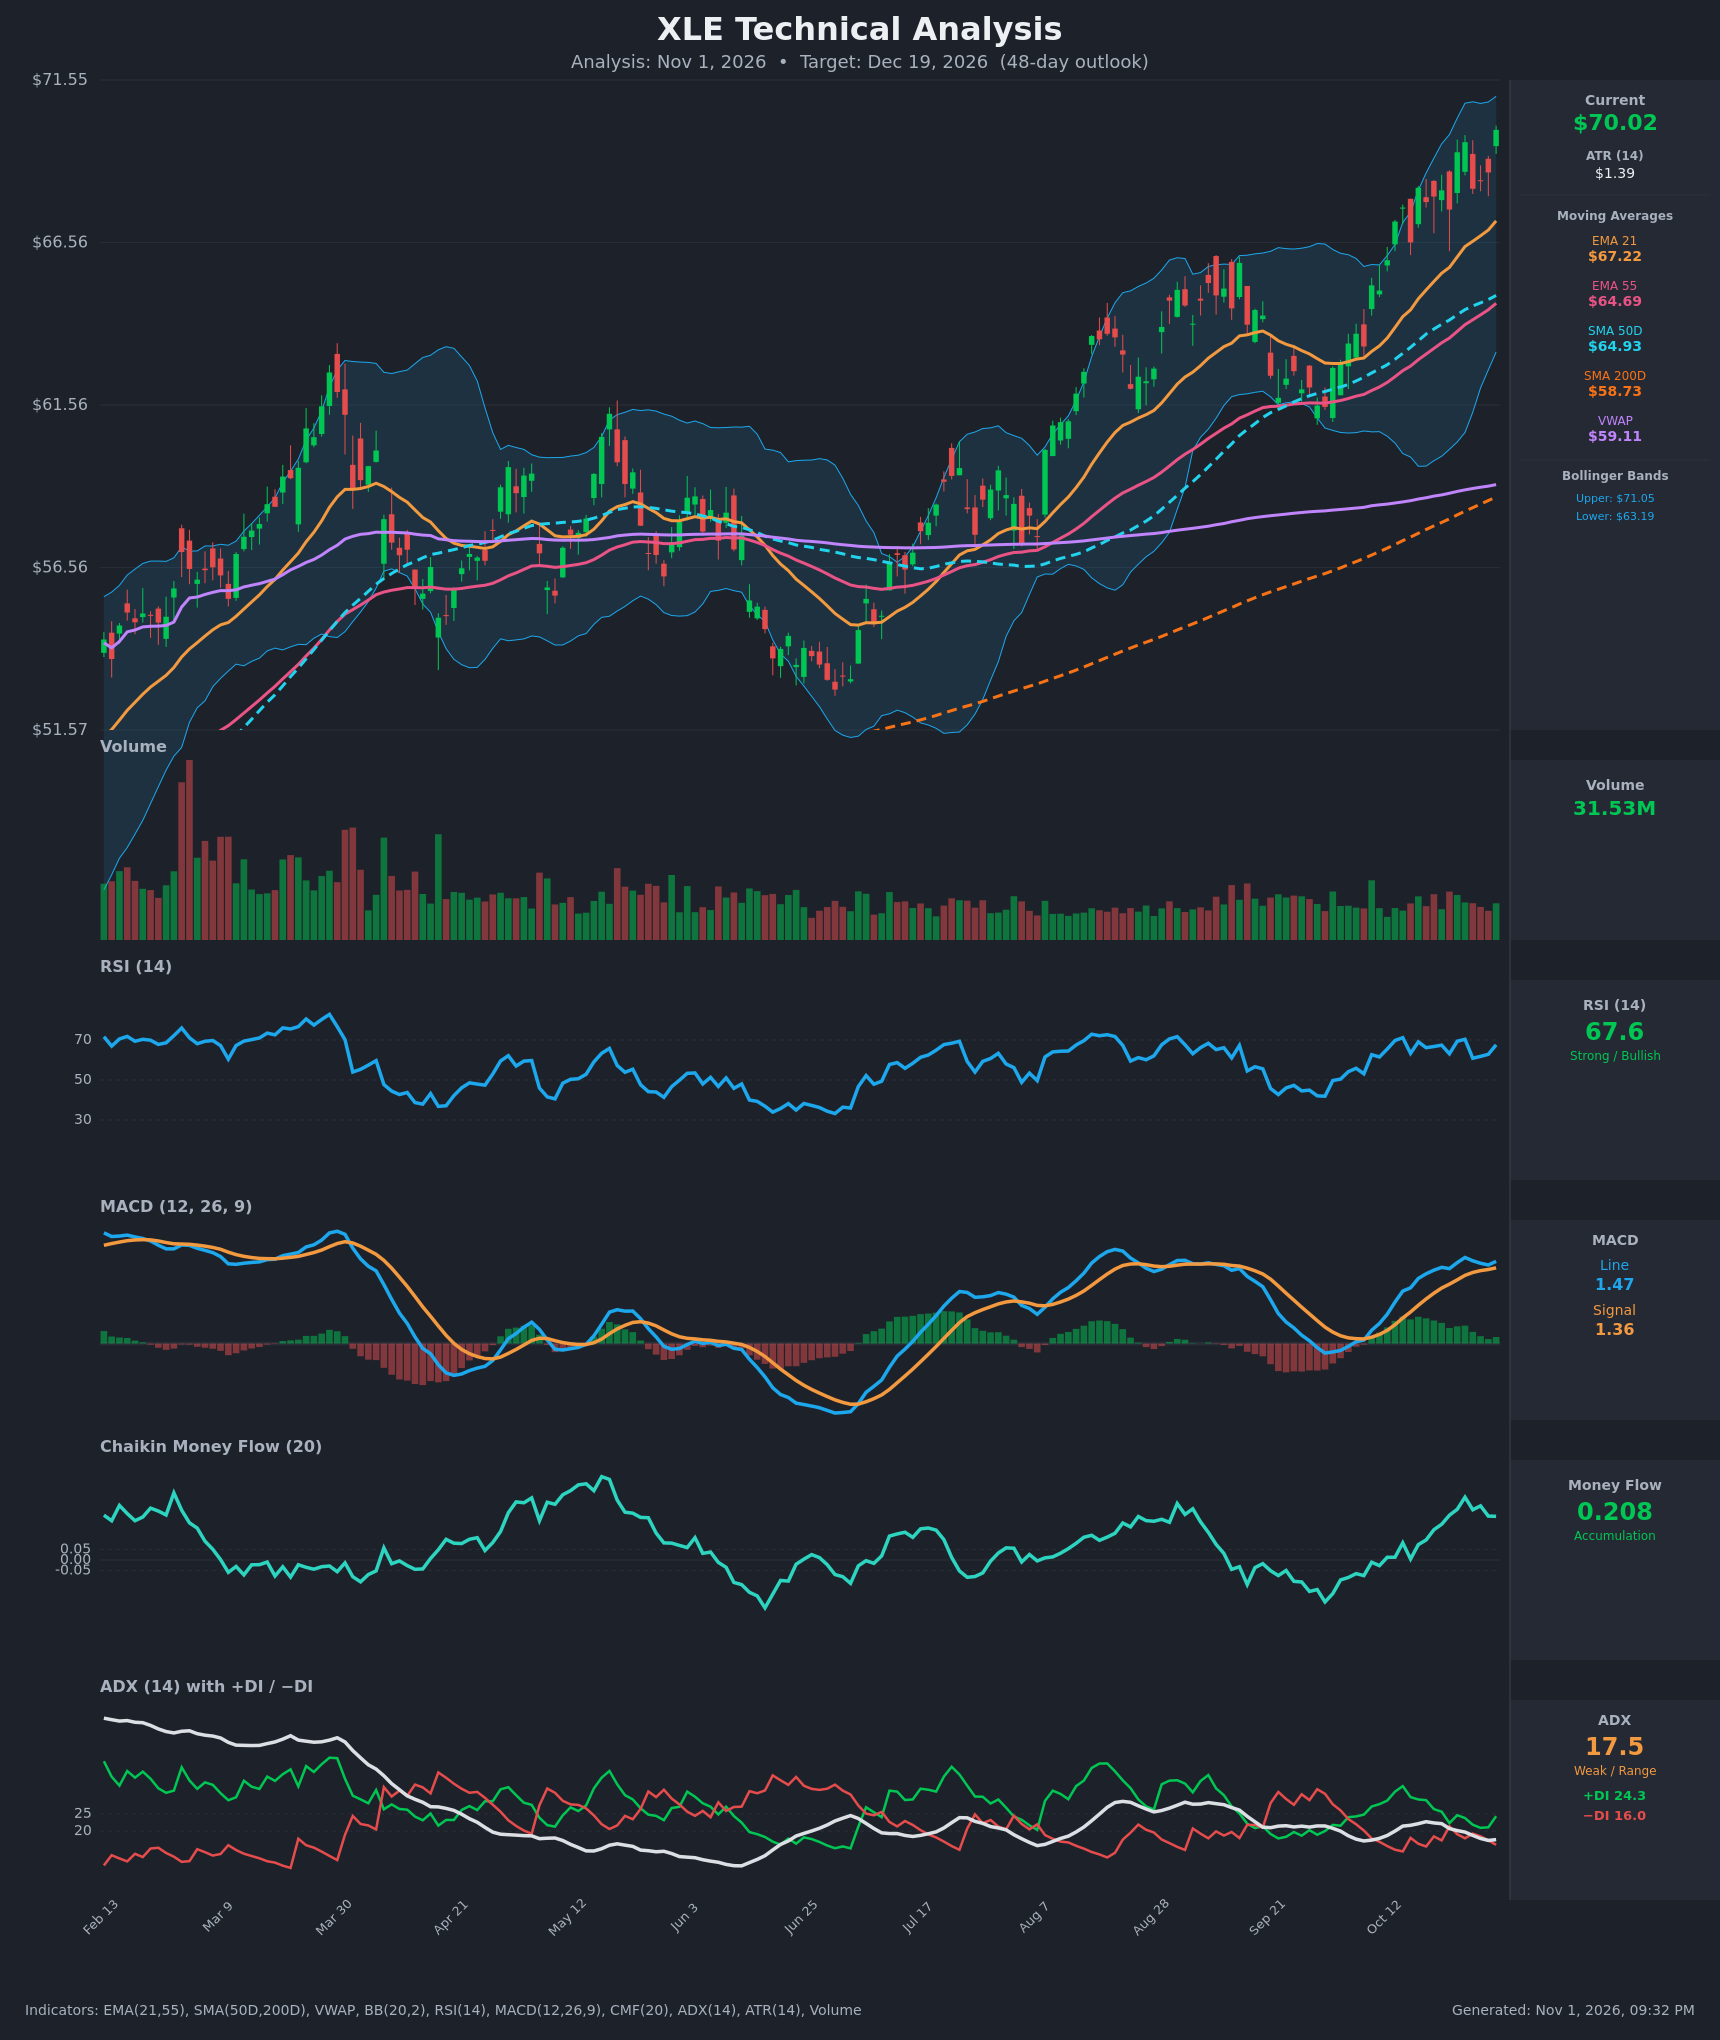
Analysis
TECHNICAL INDICATORS
- RSI (14): 67.58, just under the 70 overbought line. It has oscillated between 61 and 71 over the past two weeks and made a lower peak (70.3 on Oct 26, 71.1 on Oct 14) while price made new highs. Momentum is strong but not accelerating. [Bullish]
- 20 EMA (EMA 21 = $67.22): Price is about 4.2% above the EMA 21, which has been rising steadily and acted as support on every pullback. EMA 21 is also above EMA 55 ($64.69) and SMA 50D ($64.93), so the stack is fully bullish. [Bullish]
- MACD: Line 1.473 is above Signal 1.357, so the histogram is positive (+0.117). The histogram peaked near +0.32 on Oct 26 and has shrunk since, while price made a new high. That is a loss of momentum, not a bearish cross. [Bullish]
- Bollinger Bands (20): Upper $71.05, lower $63.19, with price at $70.02 in the upper 15% of the band (about 88% of the way up). The bands are wide and expanding. Price is riding the upper band, which shows strength but also stretch in the short term. [Neutral]
- CMF (20): +0.208, well above +0.05, and sustained positive since mid-October. This is strong accumulation and confirms the rally with real buying pressure. [Accumulation]
- ADX (14): 17.5 and falling from 22.7. +DI (24.3) is above −DI (16.0), so bulls control direction. The low ADX means the trend lacks strength, which fits a grinding advance rather than a thrust. [Weak Trend, bullish direction]
- Volume: 31.53M. Rally volume is around average, with no climactic surge, and up days have slightly better volume than down days. Participation is adequate but not a strong breakout confirmation. [Neutral-to-mildly supportive]
DIVERGENCES & TRENDS
- Mild bearish momentum divergence: Price is at a new high ($70.02) while RSI is below its Oct 14 and Oct 26 peaks and the MACD histogram has shrunk from about +0.32 to +0.12. This warns of consolidation or a pullback, not necessarily a reversal.
- ADX divergence: ADX has fallen from 22.7 to 17.5 while price rose. The advance is losing trend strength.
- No divergence in money flow: CMF is near its highs (0.208, peak 0.299), so accumulation is not deteriorating.
- Long-term trend: Price is far above SMA 200D ($58.73) and VWAP ($59.11). SMA 50D is already above SMA 200D, a golden cross that is well established, and EMA 21 is above EMA 55.
- Recent breakouts: Price broke the Aug–Sep high near $66 and is now in open space. The $66 area is now support.
- DI: +DI dipped to briefly cross below −DI on Oct 22 (22.3 vs 21.4 is not a cross, but the gap nearly closed). It has since widened again, which is a constructive recovery.
CHART PATTERNS
- Higher-high / higher-low uptrend with a steep rising channel: From the Sep low (about $60–61) price has advanced about 15%. Pullbacks have been shallow and held at the EMA 21.
- Bullish continuation (flag/pennant-like) consolidation: The Oct 23–30 action is a tight, sideways-to-slightly-up pause just below the upper Bollinger Band. A break above about $70.5–71 would complete a continuation. The measured move from the prior leg (about $4–5) points to roughly $73–75.
- Rising-wedge risk (bearish reversal): The steep advance with fading momentum partly resembles a rising wedge. A close below the EMA 21 (about $67.2) would raise this risk, with a target near $64–65 (SMA 50 and EMA 55).
- Earlier structure: The Aug–Sep range ($60–66) was the base, and the breakout from it is the primary bullish structure.
POTENTIAL SCENARIOS
- Scenario 1: Bullish Trend Continuation — Price holds above the EMA 21 and the post-breakout support near $66–67, and keeps climbing along the upper band while accumulation (CMF) persists. Trigger: daily close above $71.05 (upper band) on solid volume. Target: $72.00–$74.50. Invalidation: daily close below $67.20 (EMA 21). (50% probability)
- Scenario 2: Bearish Pullback / Mean Reversion — Fading MACD and RSI momentum, the weak ADX and the extension above the EMAs lead to a retracement toward the rising moving averages. Trigger: close below $68.20 and then $67.20, with the MACD line crossing below Signal. Target: $64.70–$66.00 (EMA 55 / SMA 50D / Aug–Sep highs). Invalidation: close back above $70.50. (30% probability)
- Scenario 3: Neutral Consolidation — Price digests the gains in a range between the EMA 21 and the upper band. Trigger: ADX stays below 20 and price oscillates between $67 and $71. Target: $68.00–$71.00. Invalidation: close outside $66.50–$72.00. (20% probability)
PRICE TARGETS
- Target Price: $72.00 (48-day horizon)
- Expected Range: $65.00 to $75.50 (width $10.50, about 15% of the current price, which fits the 30–60 day guidance)
- Key Levels: Support at $67.22 (EMA 21), Resistance at $71.05 (upper Bollinger Band)
OVERALL BIAS
OVERALL BIAS: BULLISH - Price is above every moving average, the EMA 21/55 and SMA 50/200 stacks are bullish, +DI leads −DI, and CMF at +0.208 shows strong accumulation. The weakening MACD histogram, sub-20 ADX and proximity to the upper band argue for a modest target and possible pullbacks along the way.
This is educational analysis and not financial advice.