BAC 62-day bullish forecast — Nov 1, 2026
- Bias: Bullish
- Timeframe: 62 days (made Nov 1, 2026, target date Jan 1, 2027)
- Price at analysis: $50.01
- Price target: $52.50
- Expected range: $45.50 – $56.00
- Result: Pending — graded after the close on Jan 1, 2027
Get a free AI analysis of BAC today
Analysis
TECHNICAL INDICATORS
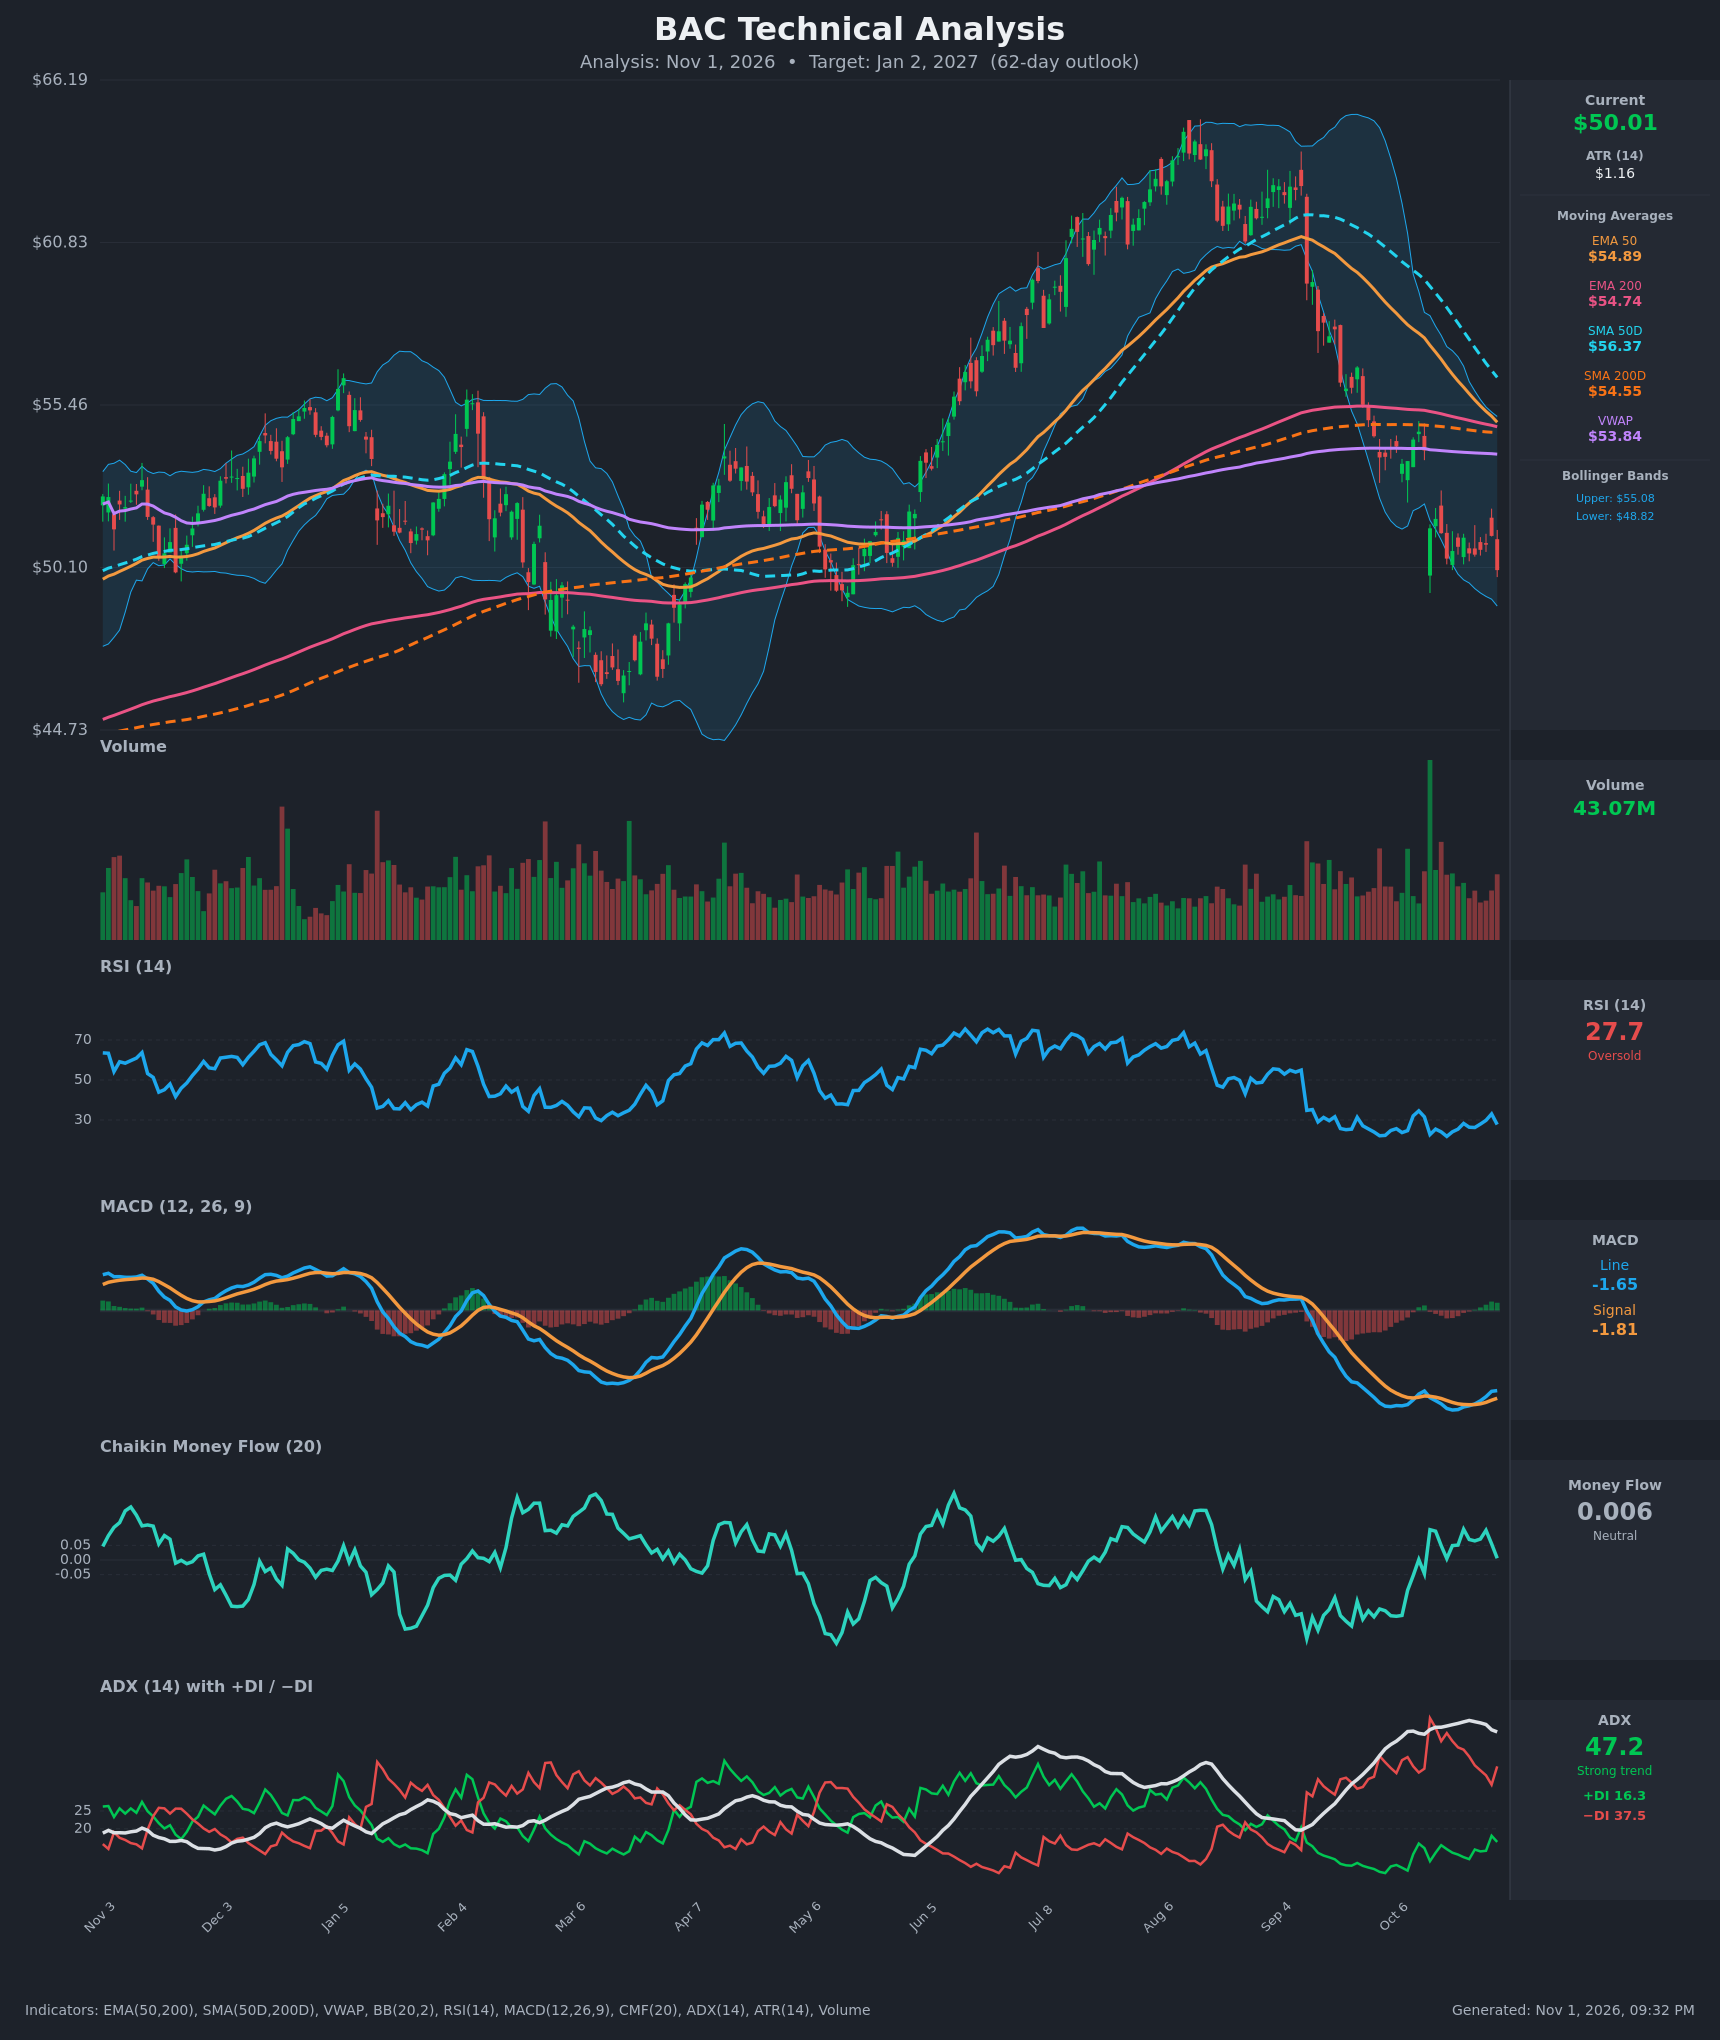
- RSI (14): 27.73, oversold. It bottomed at 21.8 on Oct 19 and has since made a higher low while price made a lower low, so downside momentum is fading even though readings stay depressed. [Bullish]
- 20 EMA: Not supplied. The EMA 50 at $54.89 and the 20-day Bollinger midline (about $51.95) both sit above price at $50.01, so short-term averages act as resistance. [Bearish]
- MACD: Line -1.649 is above signal -1.807, so a bullish crossover occurred around Oct 29. The histogram is barely positive and turning up, but both lines are deeply negative, so this is only an early relief signal. [Neutral]
- Bollinger Bands (20): Upper $55.08, lower $48.82, with price in the bottom 20% of the band, about $1.2 above the lower band. The bands are expanding after the September collapse. Price has been walking the lower half, which is typical of a downtrend, but a stretched reading can mean-revert toward the midline. [Bearish]
- CMF (20): 0.006, inside the ±0.05 neutral zone. It was mildly positive (0.05–0.10) through most of late October, so there is no heavy distribution and no clear accumulation. [Neutral]
- ADX (14): 47.2 with -DI (37.5) well above +DI (16.3). This is a very strong, mature downtrend. ADX is flattening and -DI has fallen from 51 to 37, a sign of trend exhaustion rather than acceleration. [Strong Trend – Bearish]
- Volume: 43.07M, with a capitulation-sized spike during the September–October breakdown. Recent volume is moderate with no new expansion on down days, which suggests selling pressure is cooling. [Neutral/Mildly Bullish]
- Moving averages and VWAP: Price is below the EMA 50 ($54.89), EMA 200 ($54.74), SMA 50D ($56.37), SMA 200D ($54.55) and VWAP ($53.84). The EMA 50 is converging on the EMA 200 (gap of only $0.15) and is about to cross below it, which would be a death cross. The SMA 50D is still above the SMA 200D but falling fast. [Bearish]
DIVERGENCES & TRENDS
- Bullish RSI divergence: Price fell from $50.39 (Oct 19) to $50.01 (Oct 30), but RSI rose from 21.8 to 27.7.
- MACD: It made a higher low and crossed above its signal line. Momentum is improving even though price hasn't recovered.
- Trend: The structure is a clear series of lower highs and lower lows from the ~$64 peak to $50. Every moving average is rolling over.
- ADX/DI: -DI has been falling from 51 to 37.5 while ADX stays near 47–50. This often precedes a pause or bounce, but +DI has not yet crossed above -DI.
- Pending crossover: An EMA 50/200 death cross is likely within days and is a lagging bearish headline. The SMA 50D/200D death cross is likely in the coming weeks as the 50D keeps falling.
- Price vs. prior range: Price has returned to the $49–51 zone that acted as support in March and May, which is a key demand area.
CHART PATTERNS
- Bearish flag/pennant (continuation): After the sharp drop from ~$54 to ~$51, price has been consolidating sideways at $50–51.5. A break below $49.50 would project toward about $46–47 (the flagpole is roughly $3.5–4).
- Possible Bullish Double Bottom: The March low (~$46–47), the May dip (~$49) and the current $50 zone form a broader base. This is only tentative and needs a close above about $52.50–53.
- Larger structure: The whole advance from $47 to $64 followed by a full retracement looks like a failed breakout (a rounded top/bearish reversal). That keeps overhead resistance heavy at $54.50–55, where the EMA 200, SMA 200D and EMA 50 converge.
POTENTIAL SCENARIOS
- Scenario 1: Bullish Oversold Relief Bounce — RSI divergence, the MACD cross and the $49–50 support zone favor a mean-reversion rally toward the Bollinger midline and the lower end of the MA cluster. Trigger: daily close above $51.50–52.00 with RSI back above 40. Target: $52.50–54.50. Invalidation: daily close below $48.80. (45% probability)
- Scenario 2: Bearish Trend Continuation — The strong trend (ADX 47, -DI dominant), price below all MAs and the imminent death cross lead to a breakdown of the flag and a retest of the March lows. Trigger: close below $49.50 on rising volume. Target: $46.50–47.50. Invalidation: reclaim of $52.50. (40% probability)
- Scenario 3: Neutral Range Consolidation — Price chops between $48.80 and $53 as the trend exhausts and the MAs converge. Trigger: failure to break either $48.80 or $53. Target: $50–52. Invalidation: close outside that range. (15% probability)
PRICE TARGETS
For the 62-day horizon (to about Jan 2, 2027):
- Target Price: $52.50
- Expected Range: $45.50 to $56.00 (width $10.50, about 21% of the current price, in line with the 18–30% guidance for 61–180 days)
- Key Levels: Support at $48.80, Resistance at $54.75
OVERALL BIAS
OVERALL BIAS: BULLISH - Price is deeply oversold (RSI 27.7) with a bullish RSI divergence and MACD crossover, sitting on a multi-month demand zone near $49–50, which favors a relief rally toward $52.50 over 62 days. Conviction is modest, because the strong -DI-led downtrend and the overhead MA cluster at $54.5–55 cap the upside, and a break below $48.80 would flip the view.
This is educational analysis and not financial advice.