BB 62-day bearish forecast — Nov 1, 2026
- Bias: Bearish
- Timeframe: 62 days (made Nov 1, 2026, target date Jan 1, 2027)
- Price at analysis: $8.42
- Price target: $8.05
- Expected range: $7.10 – $9.20
- Result: Pending — graded after the close on Jan 1, 2027
Get a free AI analysis of BB today
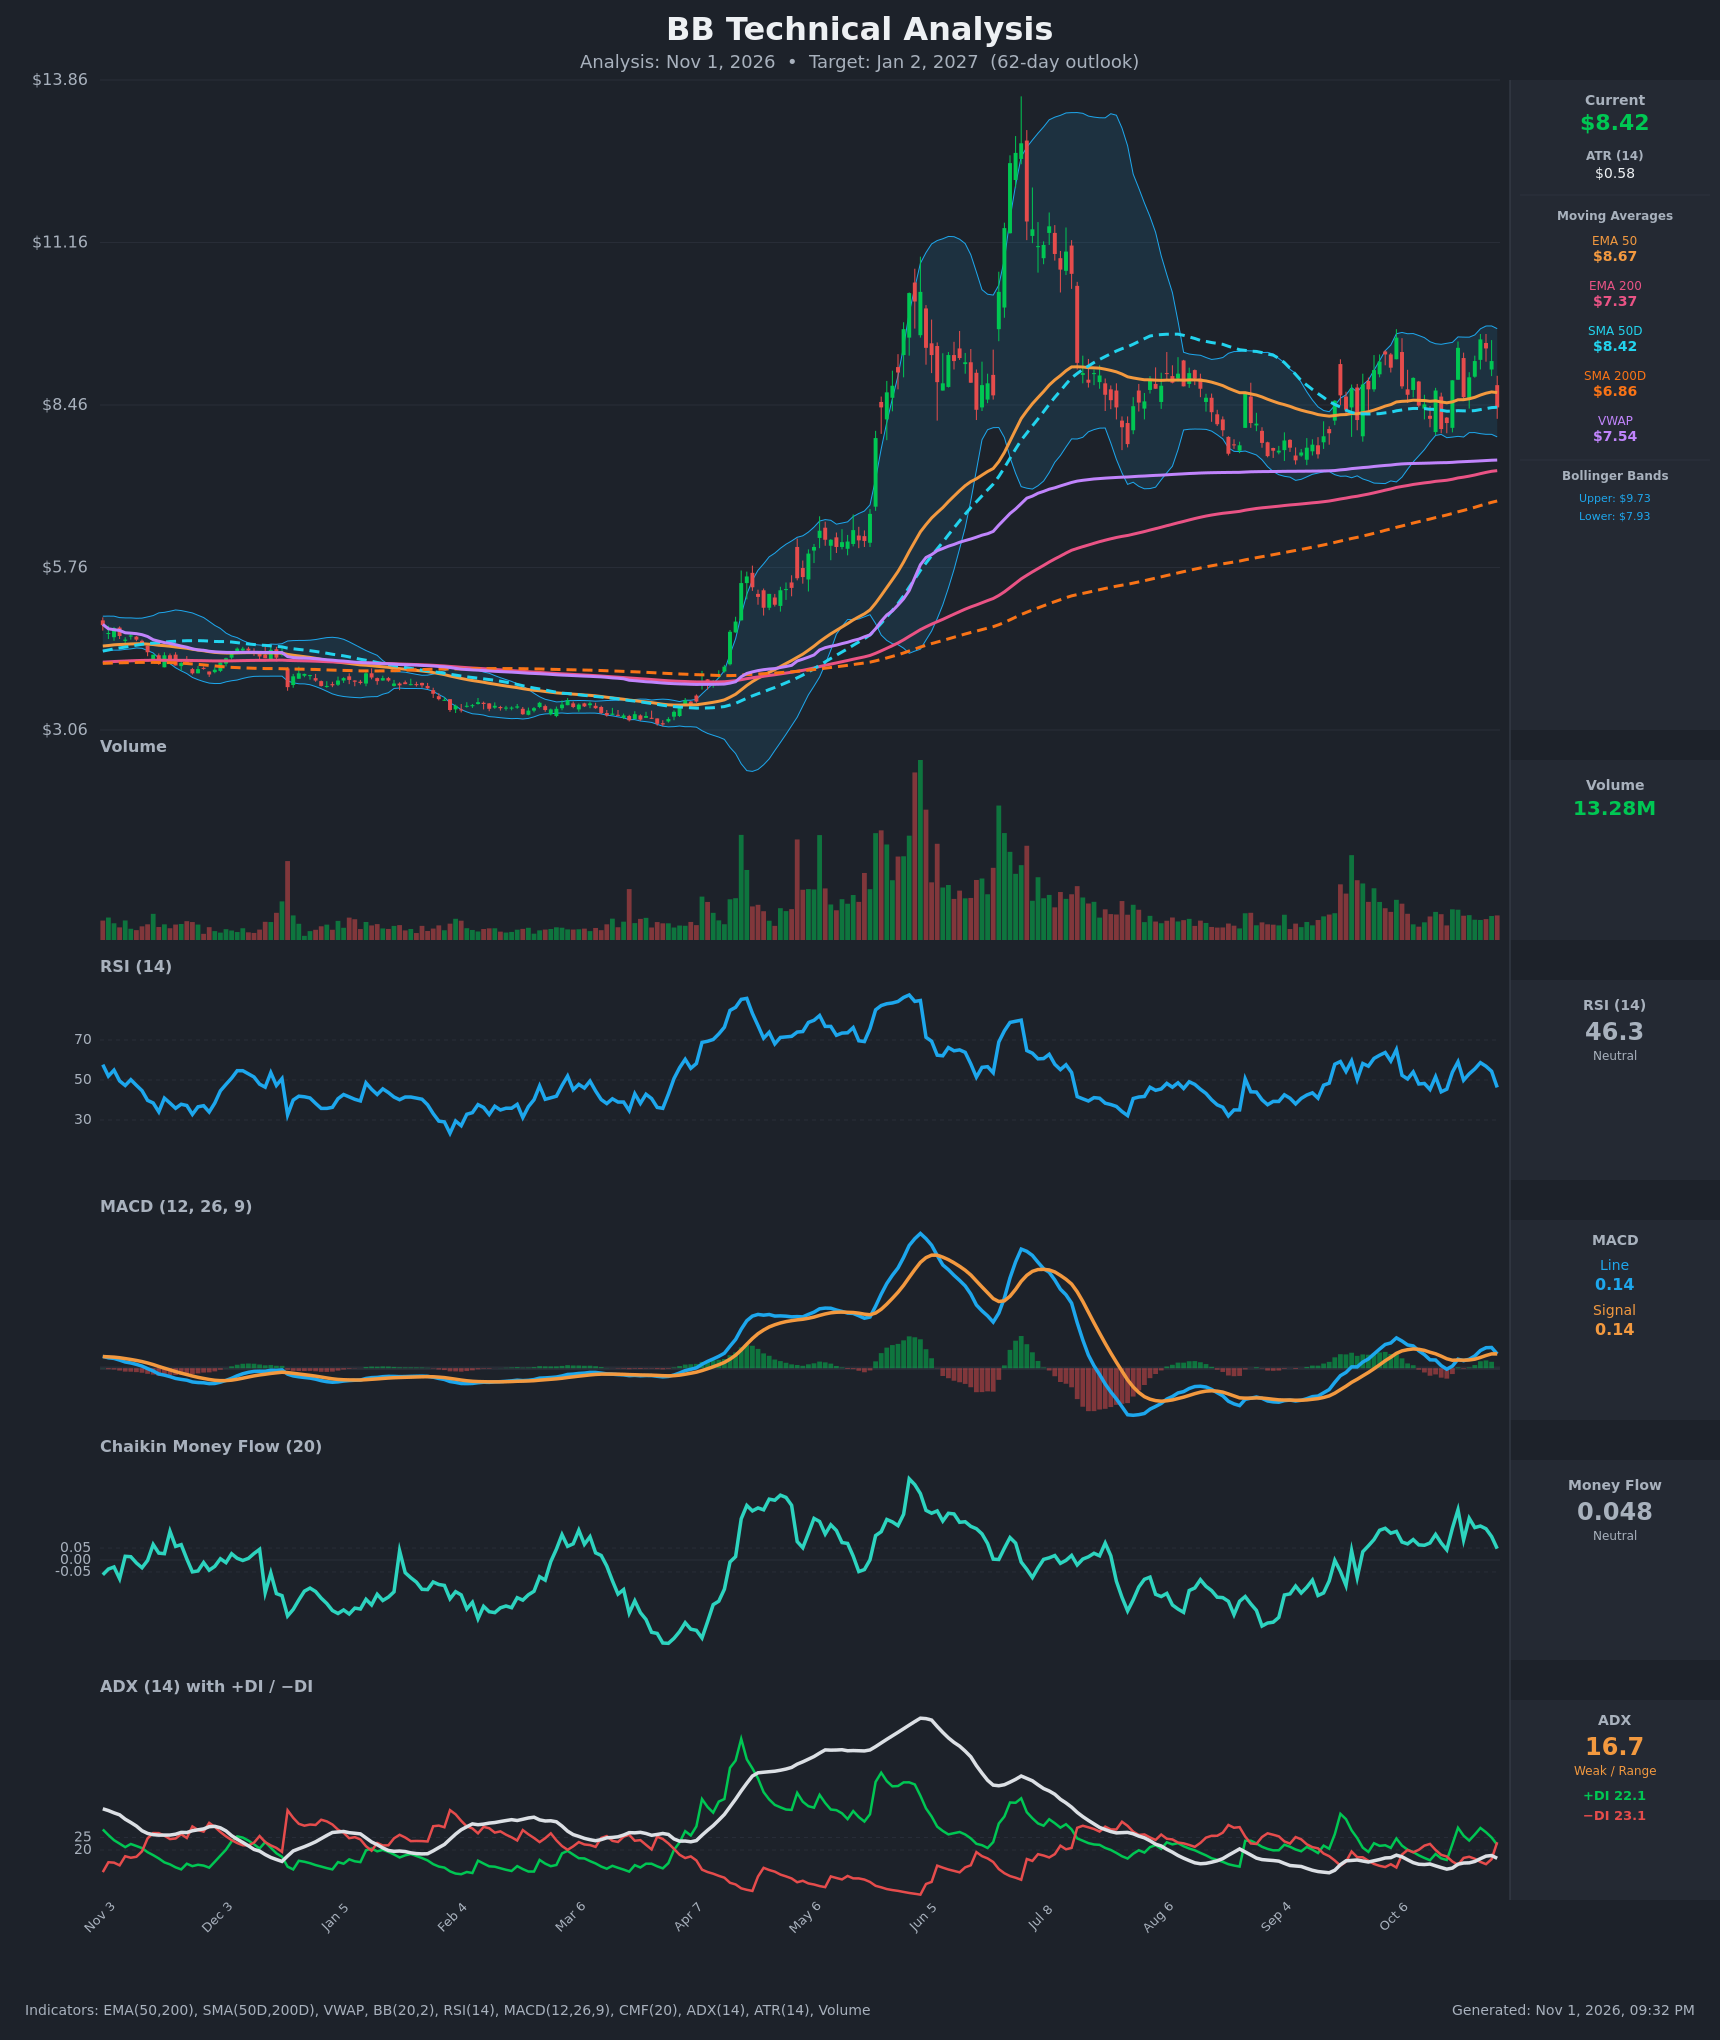
Analysis
TECHNICAL INDICATORS
- RSI (14): 46.29, down sharply from 54-59 over the last week and now below the 50 midline. Momentum is rolling over, but it is nowhere near oversold. [Neutral]
- 20 EMA: The 20 EMA is not provided. The EMA 50 is $8.67, and price at $8.42 closed back below it after a brief push above. The 50-day SMA at $8.42 sits right at price, so price is testing it. The EMA 50 acts as near-term resistance. [Bearish]
- MACD: Line 0.137 and signal 0.137 are essentially equal. The line has just fallen from 0.199, and the histogram is flat to slightly negative, which is a bearish crossover in progress. Both lines are still slightly positive. [Bearish]
- Bollinger Bands (20): Upper $9.73, lower $7.93, midline about $8.83. Price fell from the upper-band zone (~$9.55 on Oct 27) to below the midline, an 8% one-day drop. The bands are moderately wide. The path of least resistance is now toward the lower band at $7.93. [Bearish]
- CMF (20): 0.048, just inside the neutral zone and falling from 0.21 (Oct 21). It was mostly in accumulation territory in recent weeks, and the fade shows buying pressure waning. [Neutral]
- ADX (14): 16.7 with +DI 22.1 and −DI 23.1. ADX is below 20, so there is no trend. −DI has just crossed above +DI, a marginally bearish control shift. [Weak Trend, slight bearish tilt]
- Volume: 13.28M, modest and in line with the recent average. The big volume spikes were in the April-July rally, and current participation is muted. The sell-off was not accompanied by a heavy surge. [Neutral]
DIVERGENCES & TRENDS
- Long-term structure: Price is above SMA200 ($6.86), EMA200 ($7.37) and VWAP ($7.54), and the golden cross is long established (SMA50 $8.42 > SMA200 $6.86). The long-term trend is up.
- Near-term: The 50-day averages have flattened. EMA50 (~$8.67) is rolling over slightly, and price is oscillating around them in a range of roughly $7.3-$9.6 since August.
- Price failed to make a higher high above $9.55 after the Oct 27 peak.
- Short-term indicators turned down together: the MACD line is falling into the signal line, RSI dropped from 58.7 to 46.3, CMF faded from 0.21 to 0.048, and −DI crossed above +DI.
- No clear bullish or bearish divergence. Momentum followed price down.
CHART PATTERNS
- Prolonged consolidation (rectangle/range) after the spring-summer rally. Price has traded between about $7.3 and $9.6 since August, with a weak ADX. This is a continuation-style base above the rising 200-day averages.
- Possible small Bearish Double Top: peaks at ~$9.41 (Oct 21) and ~$9.55 (Oct 27) with a neckline near $8.06-$8.16. A close below the neckline would project to about $6.6-$6.7 (measured move), though I treat this as a lower-probability extension. The more probable outcome is a test of $7.5-$8.0 support.
- A break above $9.55-$9.73 would invalidate the double top and open the upper range toward $10.5.
POTENTIAL SCENARIOS
- Scenario 1: Bearish Range-Low Retest — Short-term momentum has rolled over (MACD crossover, −DI over +DI, RSI under 50), and price has been rejected at the upper Bollinger Band. Price drifts toward the lower range and VWAP zone. Trigger: daily close below $8.06 (double-top neckline) and the SMA50 at $8.42. Target: $7.55-$8.00, with an extension to $7.20 on a break of $7.93. Invalidation: daily close above $9.00 on rising volume. (45% probability)
- Scenario 2: Neutral Range Persistence — ADX stays below 20 and price keeps chopping around the 50-day averages. Trigger: failure to break either $7.93 or $9.55. Target: $8.30-$9.00. Invalidation: close outside $7.60-$9.70. (25% probability)
- Scenario 3: Bullish Range Breakout — The long-term uptrend resumes, with price holding above the rising 200-day averages. Trigger: close above $9.55-$9.73 with volume expansion. Target: $10.50-$11.00. Invalidation: close back below $8.67 (EMA50). (30% probability)
PRICE TARGETS
- Target Price: $8.05 (62-day, about -4.4% from $8.42)
- Expected Range: $7.10 to $9.20 (width $2.10, ~25% of the current price, consistent with the 61-180 day guidance)
- Key Levels: Support at $7.93, Resistance at $8.67
OVERALL BIAS
OVERALL BIAS: BEARISH - Short-term momentum has turned down (MACD line crossing under the signal, −DI above +DI, RSI under 50, price below EMA50 after rejection near the upper Bollinger Band). The long-term uptrend above the 200-day averages should limit the downside to the $7.5-$8.0 zone, so conviction is modest.
This is educational analysis and not financial advice.