IWM 62-day bullish forecast — Nov 1, 2026
- Bias: Bullish
- Timeframe: 62 days (made Nov 1, 2026, target date Jan 1, 2027)
- Price at analysis: $279.33
- Price target: $289.00
- Expected range: $261.00 – $314.00
- Result: Pending — graded after the close on Jan 1, 2027
Get a free AI analysis of IWM today
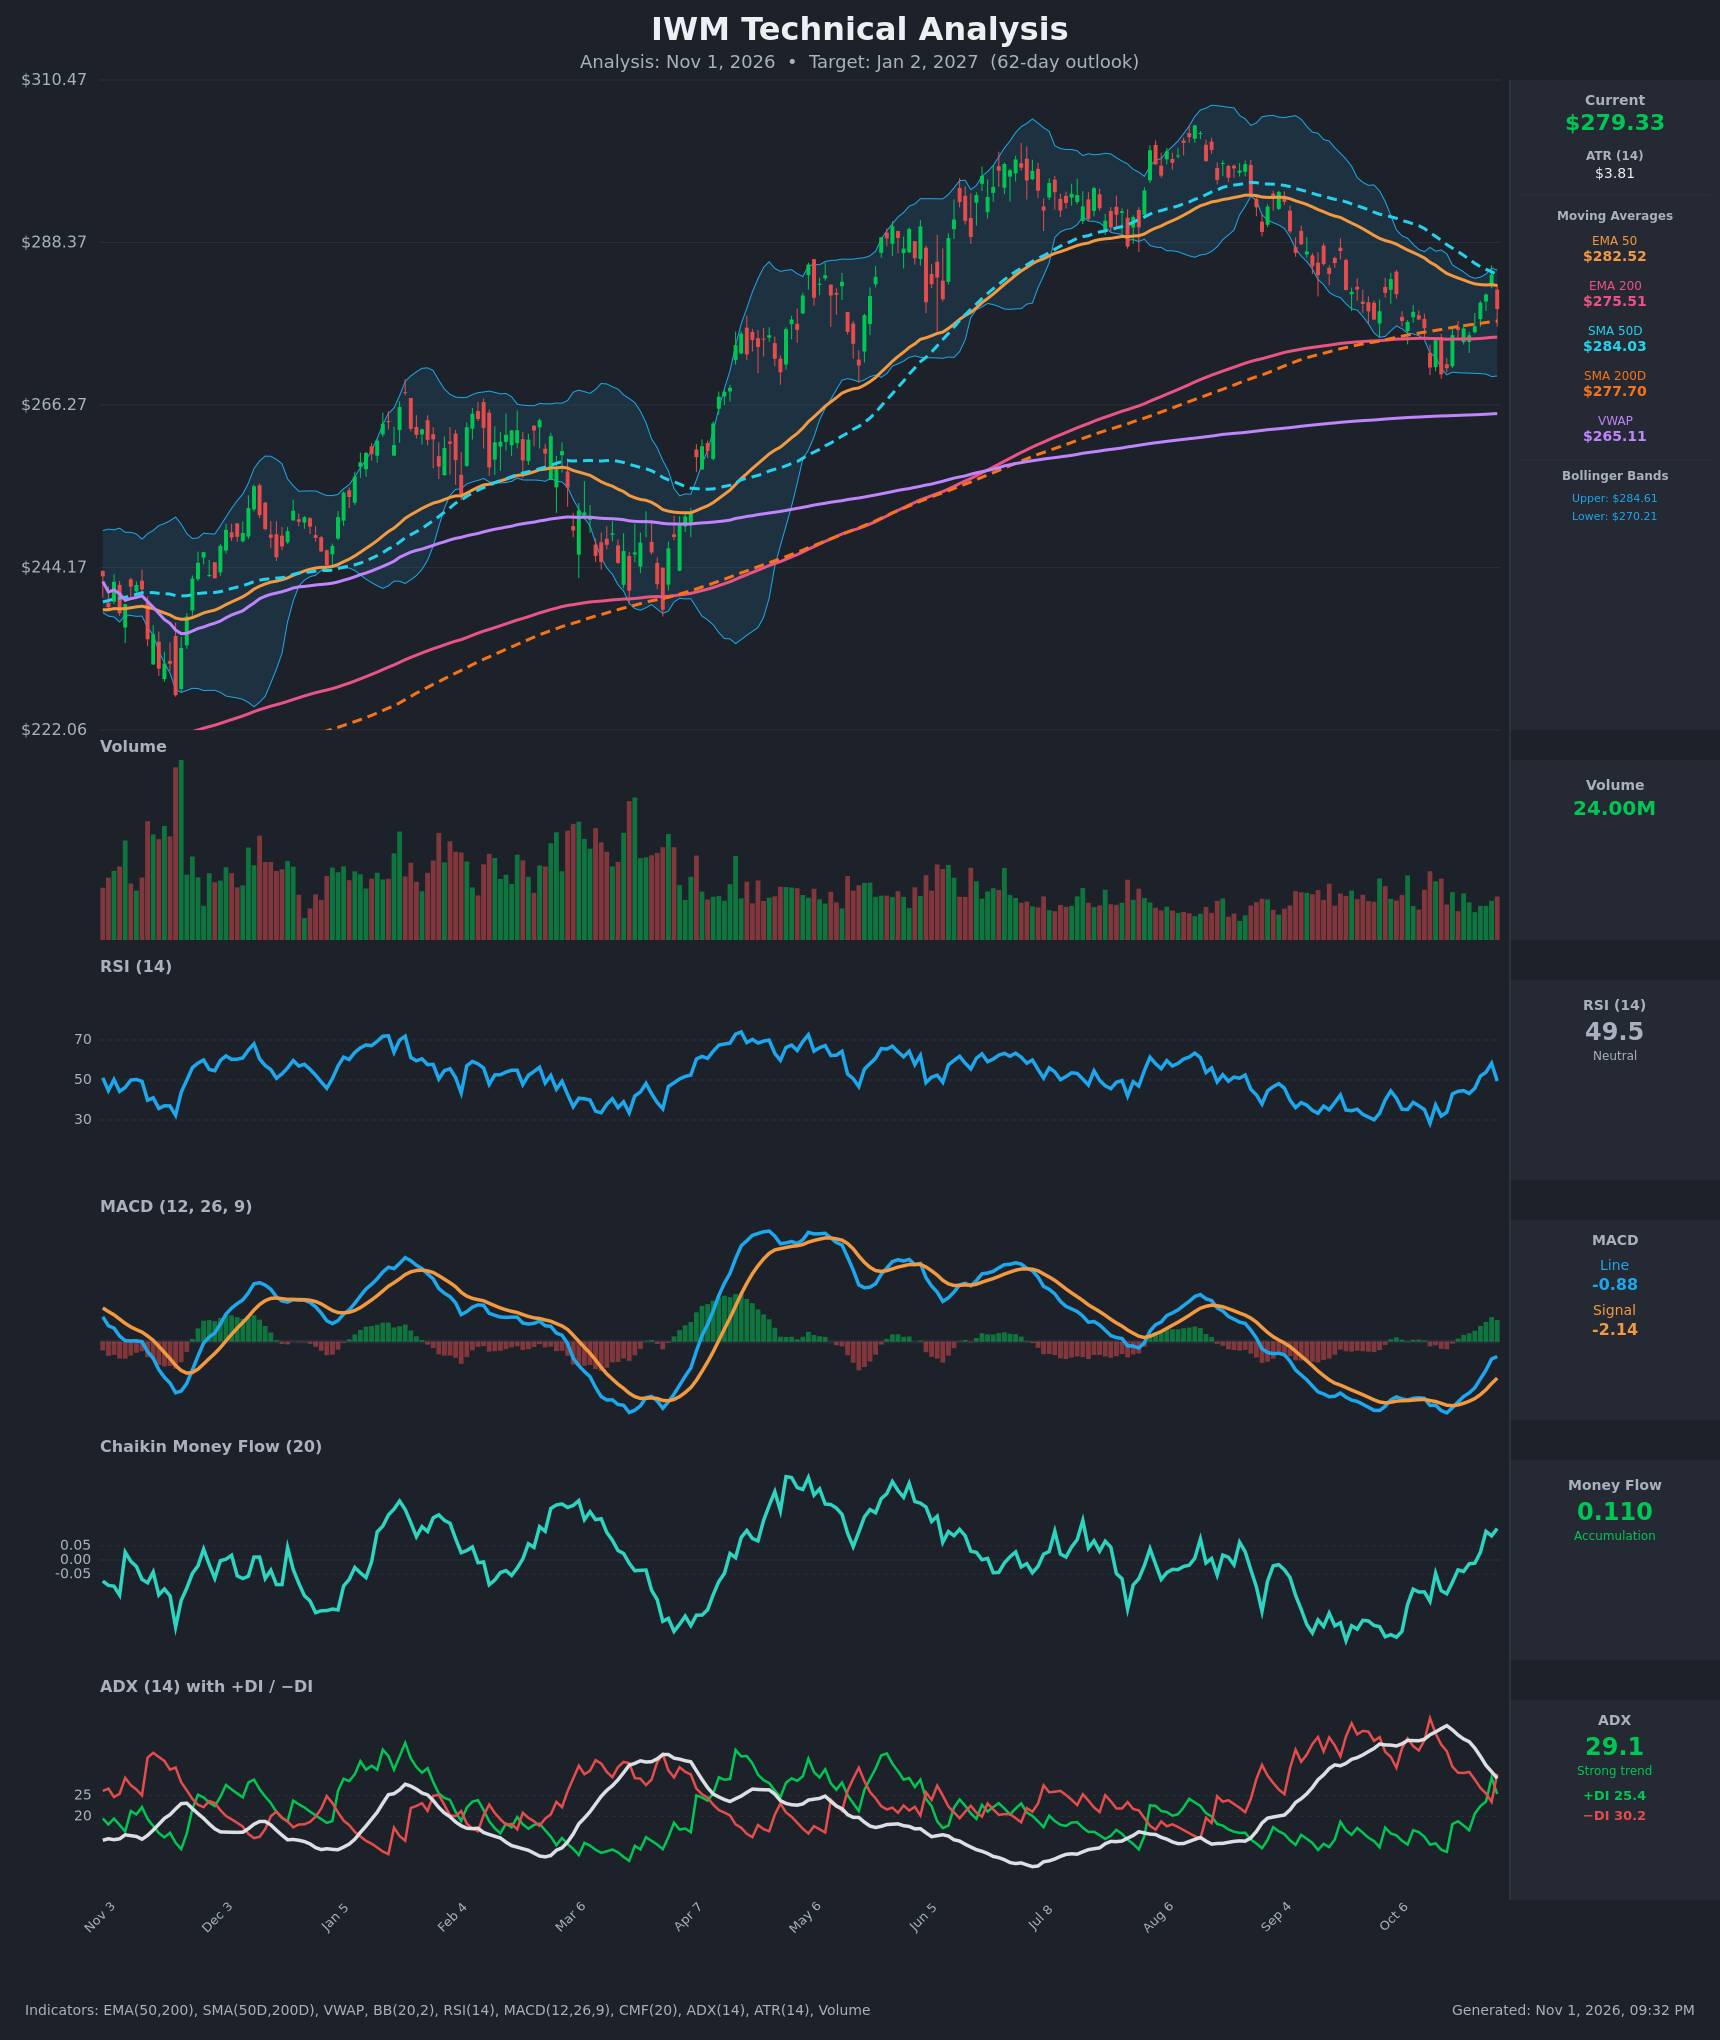
Analysis
TECHNICAL INDICATORS
- RSI (14): 49.48, dead neutral. It rolled over from 58.4 on Oct 29 after recovering from an oversold 28.3 on Oct 14. It has held above 40 since the Oct 20 rebound. [Neutral]
- 20 EMA: Not supplied. The EMA 50 ($282.52) is the closest reference, and price is slightly below it, so it acts as near-term resistance. The EMA 50 sits well above the EMA 200 ($275.51), so there is no bearish EMA cross. Price is above the EMA 200, which is the nearest support. [Neutral]
- MACD: Line -0.875 vs signal -2.139, so the histogram is positive (about +1.26) and has been rising for about 10 sessions. A bullish crossover occurred around Oct 20-22, but both lines are still below zero. This is a recovering momentum signal, not yet a confirmed uptrend. [Bullish]
- Bollinger Bands (20): Upper $284.61, lower $270.21, midline about $277.41. Price at $279.33 is just above the midline after being rejected near the upper band on Oct 29 ($284.01). The bands are narrowing from the September expansion, which points to a volatility squeeze. [Neutral]
- CMF (20): +0.110, above the +0.05 threshold and rising from -0.145 on Oct 14. It has been positive for 4 sessions, which shows buying pressure on the dip and accumulation near the $270 low. [Accumulation]
- ADX (14): 29.1 and falling from a 41.7 peak. −DI (30.2) is back above +DI (25.4) after a brief +DI lead on Oct 29. The trend is still "strong" by the number, but it is fading, and the prior downtrend is losing steam. [Strong but weakening trend – slight bearish DI edge]
- Volume: 24.00M, average and unremarkable. The rebound from mid-Oct came on modest, steady volume with no capitulation spike or breakout surge. [Neutral]
Other trend context:
- Price ($279.33) is above the SMA 200 ($277.70) and the EMA 200 ($275.51), so the long-term uptrend is intact.
- Price is below the SMA 50 ($284.03), which is still above the SMA 200. The two are converging, so a death cross is a risk if weakness resumes.
- Price is far above VWAP ($265.11), which shows a healthy long-term buyer cost basis.
DIVERGENCES & TRENDS
- Bullish divergence (Oct): Price made a marginally lower low around $270 on Oct 16 while the RSI low (32) was higher than on Oct 14 (28.3). MACD and CMF also made higher lows, which signals fading selling pressure.
- Trend of indicators: MACD histogram, CMF and RSI have all improved since mid-Oct. ADX is rolling over from 41.7, which suggests the Aug–Oct downtrend is exhausting.
- Crossovers:
- MACD crossed bullishly in the third week of October.
- −DI/+DI flipped back to −DI on top on Oct 30, a minor negative.
- The 50/200 SMAs are narrowing, and a bearish cross would need price to break below the $270-275 zone.
- Rejection: Oct 29's push to $284 met the SMA 50, the upper BB and the EMA 50 together, and the next day closed down -1.7%. Bulls need to reclaim that zone.
CHART PATTERNS
- Bullish Double Bottom (reversal): Two lows near $270-271 in mid-Oct, with a neckline around $284 (the Oct 29 high and the SMA 50 confluence). The pattern is only confirmed on a close above about $284-285. The measured move is roughly +$14 (neckline minus the $270 low), which points to about $298.
- Pullback within a larger uptrend: The decline from the Aug peak (~$303) to $270 is a roughly 11% correction. It holds above the rising 200-day averages, which is typical of a consolidation within a broader bull trend.
- Bearish risk: Failure at $284 followed by a break of $270 would turn the structure into a lower-high sequence, with a downside measured move toward $255-258.
POTENTIAL SCENARIOS
- Scenario 1: Bullish Double Bottom Breakout — Price holds the 200-day averages, MACD pushes above zero and CMF stays positive, driving a breakout through the neckline. Trigger: daily close above $284.60 (SMA 50 and upper BB), ideally on expanding volume. Target: $297-303 (double-bottom measured move to the prior Aug high). Invalidation: close below $270. (50% probability)
- Scenario 2: Bearish Failed Rally / Lower High — The $284 rejection holds, −DI stays on top, the 50/200 SMAs converge toward a death cross, and price breaks the double-bottom support. Trigger: close below $275.50 followed by a break of $270. Target: $255-258. Invalidation: close above $285. (28% probability)
- Scenario 3: Neutral Range Consolidation — The BB squeeze resolves into a choppy range between the 200-day averages and the SMA 50. Trigger: repeated closes between $271 and $284 with ADX dropping below 20. Target: $275-283. Invalidation: close outside $268-$287. (22% probability)
PRICE TARGETS
- Target Price: $289.00 (62-day, +3.5% from the current $279.33)
- Expected Range: $261.00 to $314.00 (width $53 = about 19% of current price, in line with the 61-180 day guidance)
- Key Levels: Support at $275.50 (EMA 200; secondary support at $270.20, the lower BB and double-bottom low), Resistance at $284.00 (SMA 50, upper BB and neckline; next resistance near $303)
OVERALL BIAS
OVERALL BIAS: BULLISH - Price holds above the rising 200-day averages. A double-bottom has formed with bullish divergences, CMF shows accumulation, and the MACD has crossed up with a rising histogram. The bias is only modestly bullish, because −DI is still on top and $284 remains overhead resistance.
This is educational analysis and not financial advice.