QCOM 62-day bearish forecast — Nov 1, 2026
- Bias: Bearish
- Timeframe: 62 days (made Nov 1, 2026, target date Jan 1, 2027)
- Price at analysis: $164.79
- Price target: $157.00
- Expected range: $140.00 – $175.00
- Result: Pending — graded after the close on Jan 1, 2027
Get a free AI analysis of QCOM today
Analysis
TECHNICAL INDICATORS
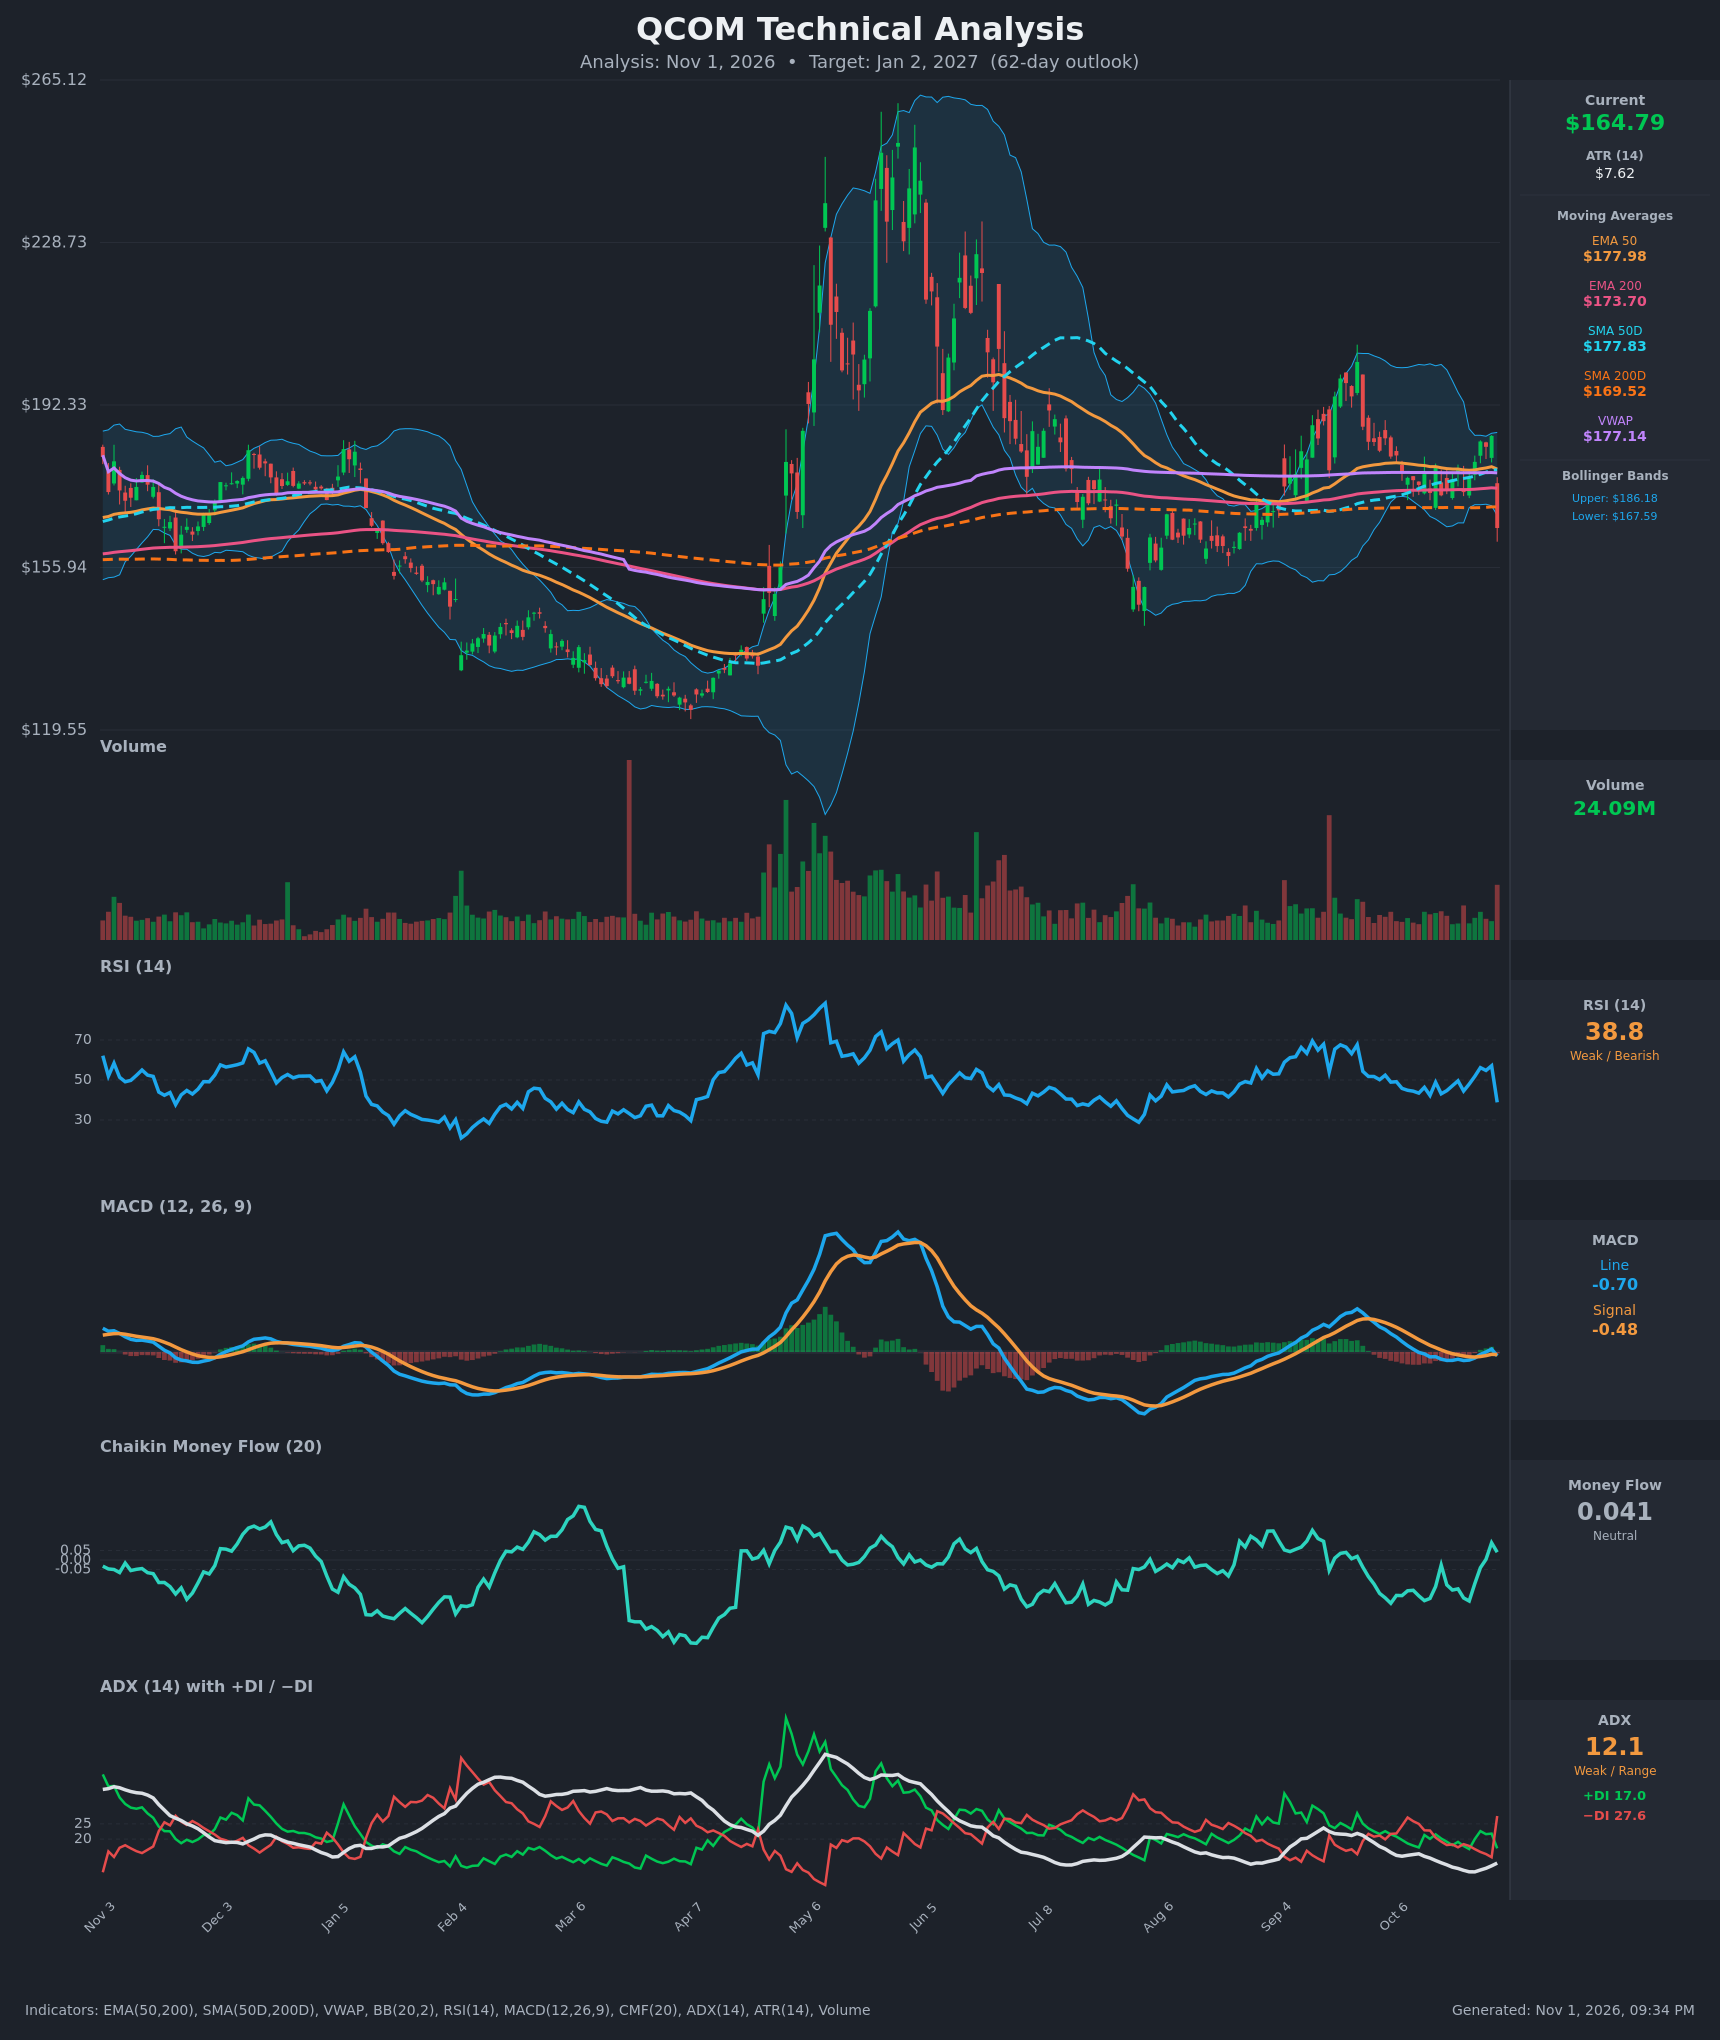
- RSI (14): 38.84, down sharply from 57.1 on Oct 29. It is a weak reading but not yet oversold (<30), so there is room to fall further. The longer-term range since August has held RSI mostly between 40 and 55. [Bearish]
- 20 EMA: No 20 EMA value was supplied. Price at $164.79 sits well below the EMA 50 ($177.98) and VWAP ($177.14), and below the EMA 200 ($173.70), so the short-term average structure is overhead resistance. The Oct 30 gap down erased the whole Oct 26-29 rally. [Bearish]
- MACD: Line -0.70 is below Signal -0.48, a fresh bearish crossover. The line had just turned positive (+0.53) one day earlier, which makes this a sharp reversal. The histogram has flipped negative and the zero line was rejected. [Bearish]
- Bollinger Bands (20): Price closed below the lower band ($167.59), with the upper band at $186.18. The close is a band-walk break after a roughly 11% one-day drop. This can bring a short-term snapback, but a close outside the band after a gap is also a sign of breakdown momentum. [Bearish]
- CMF (20): 0.041 is in the neutral zone (between -0.05 and +0.05). It rose from -0.2 over the last two weeks, so buying pressure was building before the drop. The Oct 30 reading has not yet absorbed the full distribution of the gap day. [Neutral]
- ADX (14): 12.1 is a weak, range-bound trend, but it is turning up from 9.2. −DI (27.6) jumped above +DI (17.0), a bearish DI crossover that signals bears taking control. [Weak Trend, Bearish direction]
- Volume: 24.09M, the largest bar on the right side of the chart and well above the recent average. It is a high-volume red candle, so the break is decisive rather than a low-volume drift. [Distribution / Bearish]
DIVERGENCES & TRENDS
- No clear divergence. RSI and MACD both confirmed the lower close.
- Price lost the SMA200D ($169.52), EMA200 ($173.70), SMA50D ($177.83) and EMA50 ($177.98) in one session. This is a significant technical breakdown.
- SMA50D ($177.83) is above SMA200D ($169.52), so there is no death cross yet. The 50 averages are flat, though, and price is now below the 200s.
- MACD gave a bearish crossover on Oct 30 after a brief bullish cross on Oct 28-29. This was a failed bullish attempt.
- The Oct 29 bar at $185.41 was a lower high than the Sep peak near $200. The 62-day structure shows lower highs.
- ADX at 12 is very low and will not confirm a trend until it rises above 20-25. The DI flip suggests the trend is starting to form to the downside.
- The CMF uptick into the drop suggests some buyers may step in near the lower band, which limits conviction.
CHART PATTERNS
- The recent price action is a range of roughly $156-$186 since August. The Oct 27-29 highs at about $184-185 failed at the same area as earlier peaks, which resembles a Bearish Double/Triple Top inside a rectangle.
- The Oct 30 gap candle breaks below the middle of the range and the 200-day averages. It is not a complete classic pattern until the range floor near $156 breaks.
- If the floor at $156 gives way, the measured move from a $156-$185 rectangle (about $29) points to roughly $127. That is an extended scenario and not the base case for 62 days.
- No bullish reversal pattern (double bottom, inverted H&S) is confirmed. A snapback would need to reclaim $169.5-$174.
POTENTIAL SCENARIOS
- Scenario 1: Bearish Post-Gap Continuation — Price failed to hold the 200-day averages after a high-volume gap and drifts toward the lower half of the range. Trigger: a daily close below $162 on MACD and DI bearish continuation. Target: $150-$157, with an extension to $143 if $156 breaks. Invalidation: a daily close above $174 (EMA200) with a rising CMF. (45% probability)
- Scenario 2: Bullish Mean-Reversion Rebound — The close below the lower Bollinger Band triggers a snapback, and the gap partly fills. Trigger: a reclaim of $169.5 (SMA200D) on rising volume and RSI above 50. Target: $174-$178 (EMA200 / EMA50 / VWAP cluster). Invalidation: a close below $158. (33% probability)
- Scenario 3: Neutral Choppy Consolidation — Weak ADX keeps price between $157 and $172 and the stock digests the gap. Trigger: low-volume sideways closes. Target: $160-$170. Invalidation: a close outside the $155-$175 band. (22% probability)
PRICE TARGETS
- Target Price: $157.00 (62 days, Jan 2, 2027)
- Expected Range: $140.00 to $175.00 (width $35, about 21% of the current price, which fits the 18-30% guide for 61-180 days)
- Key Levels: Support at $156.00, Resistance at $169.52
OVERALL BIAS
OVERALL BIAS: BEARISH - The high-volume 11% gap down broke below the 200-day averages, with a bearish MACD crossover, −DI taking control, and price closing below the lower Bollinger Band. The main offset is a snapback from the oversold band and weak ADX, so conviction is moderate and a rebound toward $170-$175 is the main alternative.
This is educational analysis and not financial advice.