QQQ 62-day bearish forecast — Nov 1, 2026
- Bias: Bearish
- Timeframe: 62 days (made Nov 1, 2026, target date Jan 1, 2027)
- Price at analysis: $690.49
- Price target: $672.00
- Expected range: $610.00 – $748.00
- Result: Pending — graded after the close on Jan 1, 2027
Get a free AI analysis of QQQ today
Analysis
TECHNICAL INDICATORS
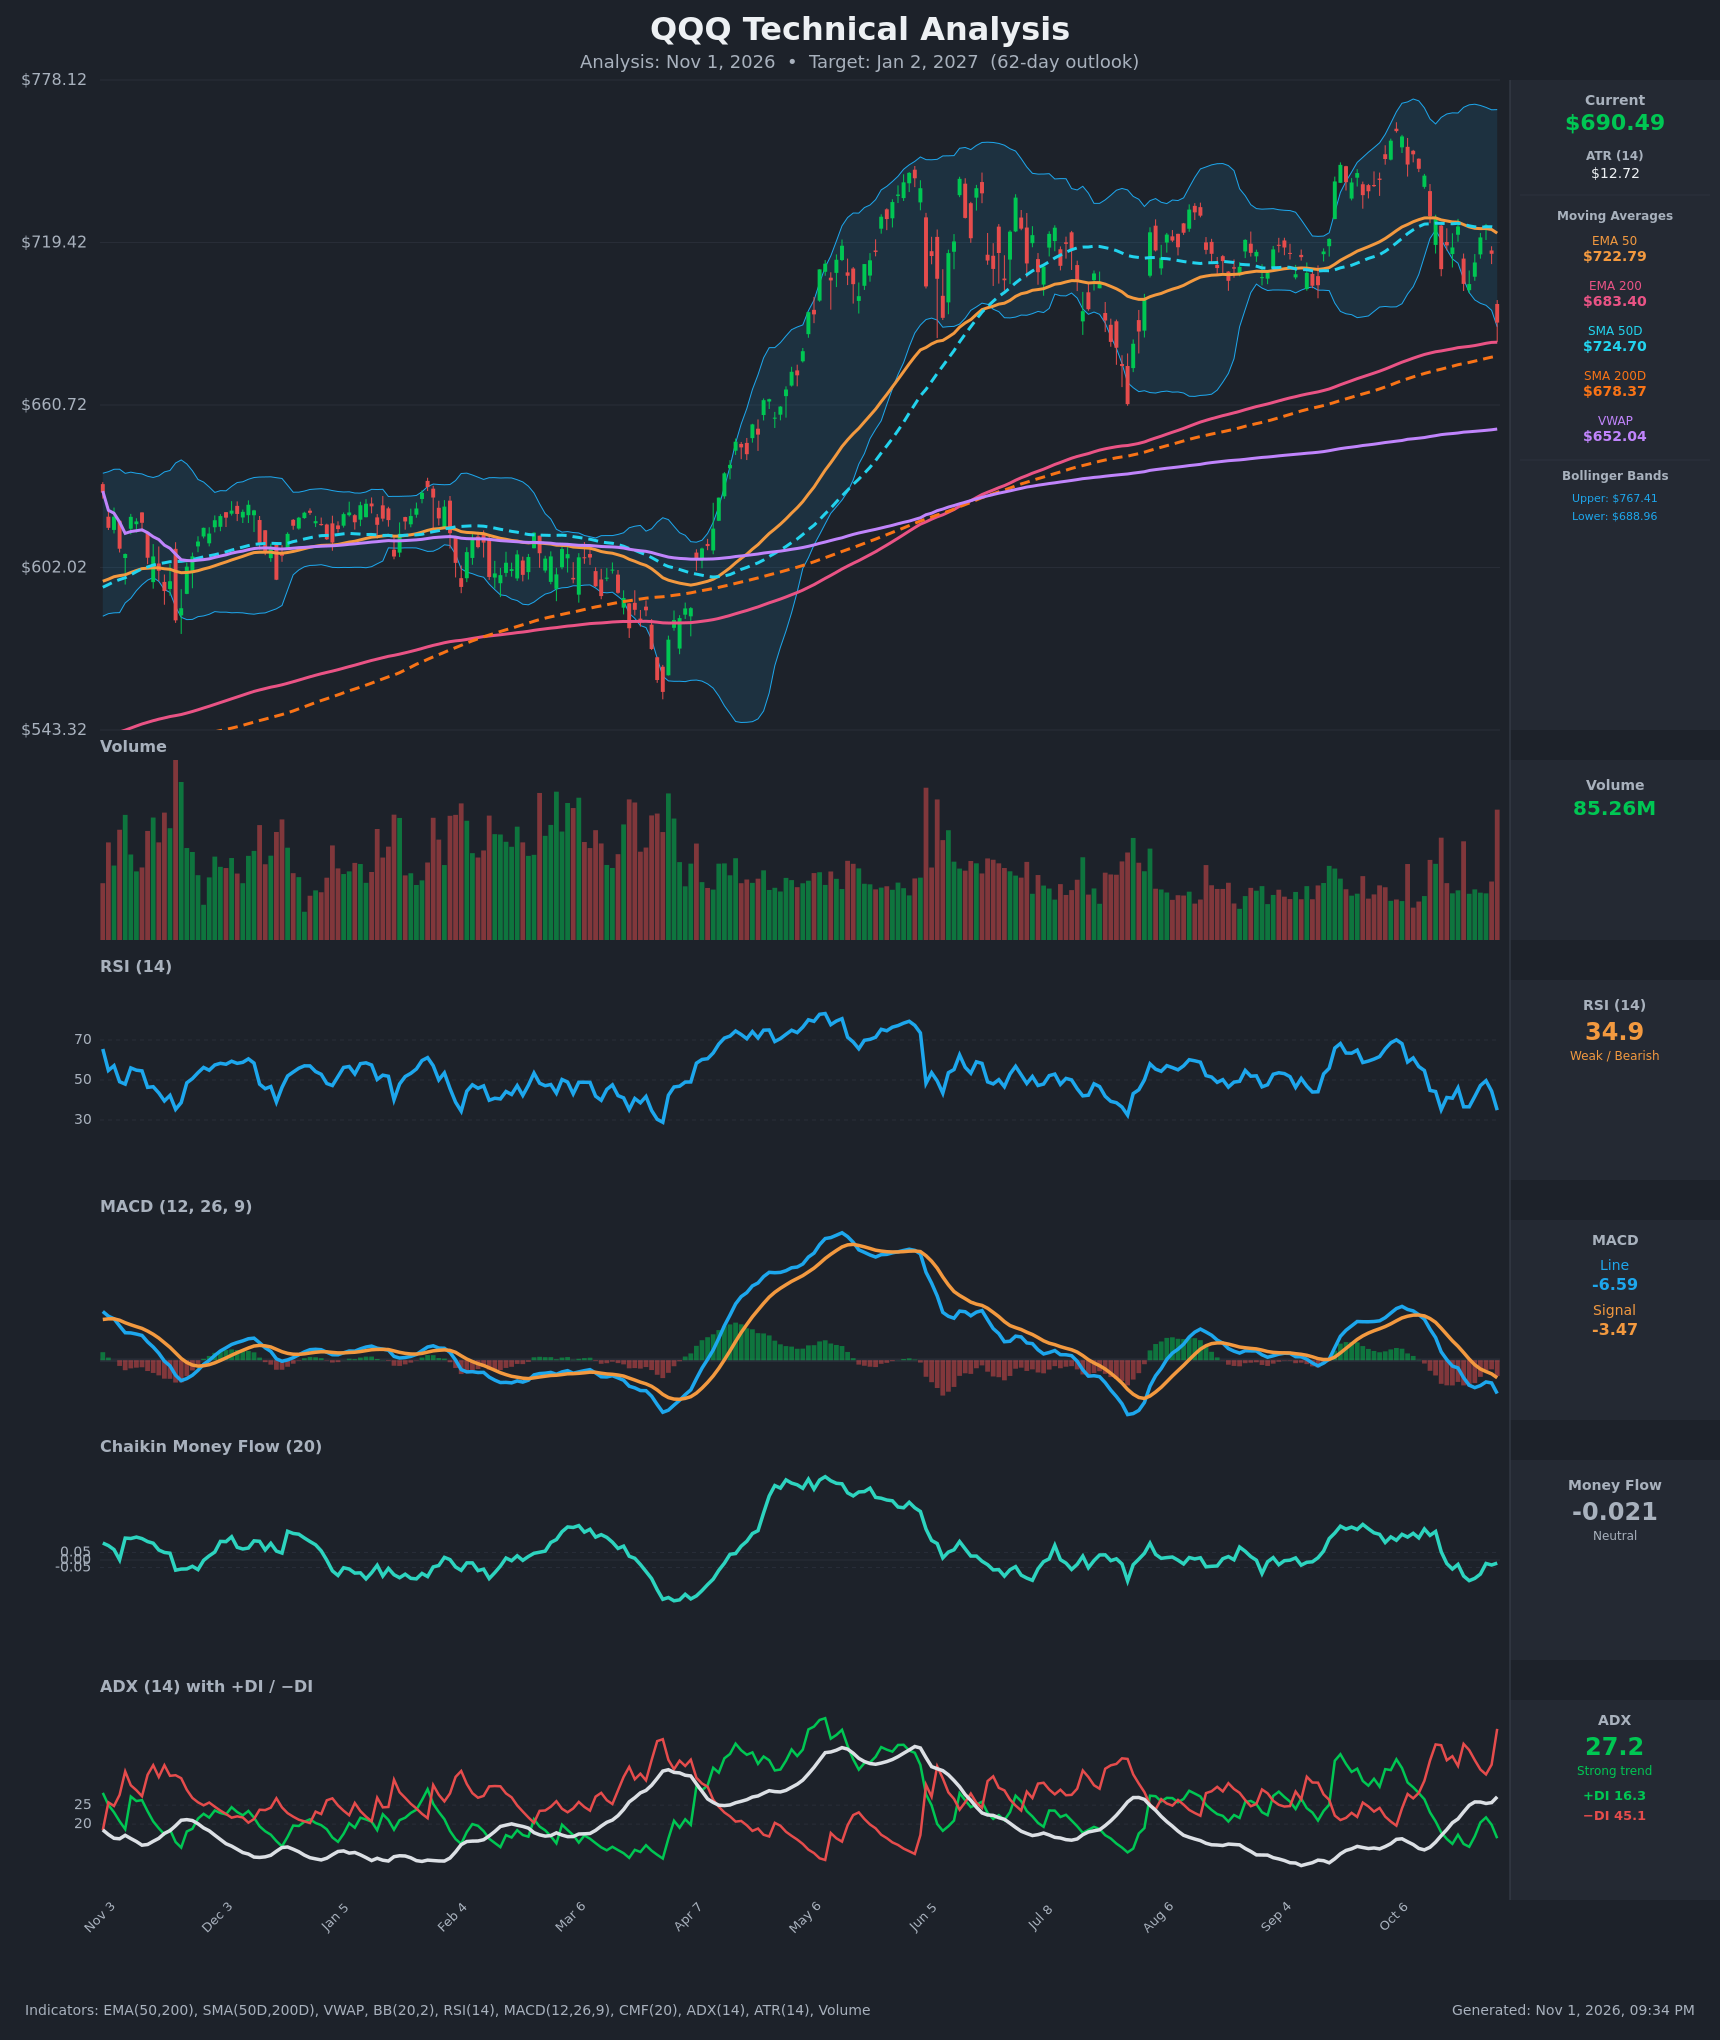
- RSI (14): 34.93, down from 49.6 on Oct 28 and approaching oversold (<30) without reaching it. It has been below 50 since Oct 14, and the latest drop shows momentum accelerating down. [Bearish]
- 20 EMA: The 20 EMA isn't supplied. The EMA 50 ($722.79) and SMA 50 ($724.70) are the nearest moving averages, and price is about 4.5% below both. They now act as overhead resistance, and the EMA 50 is sloping down. [Bearish]
- MACD: Line -6.59 is below signal -3.47 and below zero. It crossed below the signal on Oct 20-22 and crossed below zero around Oct 20, and the gap is widening, so the histogram is increasingly negative. [Bearish]
- Bollinger Bands (20): Upper $767.41, lower $688.96. Price at $690.49 is pinned against the lower band after a sharp 3.5% drop on Oct 30. The bands are wide, reflecting recent volatility. A walk down the lower band is possible, but a bounce toward the mid-band (~$728) is also a risk. [Bearish]
- CMF (20): -0.021, inside the ±0.05 neutral zone but turned negative since Oct 19 after readings of +0.15 to +0.20 earlier in the month. The trend is deteriorating toward distribution. [Neutral]
- ADX (14): 27.2 and rising from 13 on Oct 12, so a strong trend is developing. −DI at 45.1 is far above +DI at 16.3, a wide gap in favor of the bears. [Strong Trend – Bearish]
- Volume: 85.26M on the latest bar, among the heaviest in recent months and attached to a large red candle. A heavy-volume breakdown candle suggests real selling and not a low-conviction drift. [Bearish – Distribution Pressure]
Long-term context:
- Price is above EMA 200 ($683.40) and SMA 200 ($678.37) by only 1.0% and 1.8%.
- EMA 50 and SMA 50 are above their 200-day counterparts, so there is no death cross and the long-term uptrend is technically intact.
- Price is well above VWAP ($652.04).
DIVERGENCES & TRENDS
- No clear bullish divergence: RSI is ~35 now versus ~35 on Oct 16, but price is lower ($690 vs $710). That is only a marginal, unconfirmed divergence.
- MACD: The bearish crossover and zero-line break are confirmed. It is also rolling over from a lower peak than the May high, which marks fading momentum.
- DI and ADX: −DI overtook +DI on Oct 13 and has stayed dominant since, while ADX is rising. That is a sign of a strengthening downtrend.
- MA structure: Price lost the EMA 50 and SMA 50, which had acted as support from Jul to Oct. Both are now flat to declining and converging with price.
- CMF: Flipped from strong accumulation (+0.20) to slightly negative, confirming that buyers faded.
- Key tests: The EMA 200 ($683.40) and SMA 200 ($678.37) sit within 1-2% below price. A close below them would be a major technical break.
CHART PATTERNS
- Possible Bearish Double Top / broad topping structure: The Oct peak near $770 follows a prior high at ~$735-740 in May-Jun, with lower-high attempts in between. The neckline sits near the Aug low (~$662). A break below it would project a deeper decline, but that has not yet happened.
- Range/consolidation breakdown: Price spent Jun-Oct in a $662-$745 range and has now fallen from the upper half to the lower half on heavy volume. A drop through the 200-day averages opens a retest of the $662 range low.
- Alternate read: If $678-$683 holds, this is a pullback within an uptrend, similar to the Aug bounce off $662. This is a lower-probability read.
- A full Head and Shoulders is not clearly formed, so these patterns remain tentative.
POTENTIAL SCENARIOS
- Scenario 1: Bearish Breakdown Through the 200-Day Averages — Heavy-volume selling continues with −DI dominant and ADX rising. Price loses the EMA/SMA 200 zone and heads to the Aug low area, with room to test the lower end of the range. Trigger: daily close below $678 (SMA 200). Target: $660-$672 first, extending to $630-$640. Invalidation: daily close back above $725 (EMA 50/SMA 50). (45% probability)
- Scenario 2: Bullish Bounce off the 200-Day Averages — RSI near 30-35 and the lower Bollinger Band attract dip buyers, as in Aug. Price recovers the EMA 50 and rebuilds toward the prior highs. Trigger: reversal candle at $678-$683 and a close above $725. Target: $740-$760. Invalidation: close below $670. (35% probability)
- Scenario 3: Neutral Range-Bound Chop — Price oscillates between the 200-day averages and the 50-day averages. Trigger: failure of both the breakdown and the reclaim. Target: $675-$715. Invalidation: close outside $660-$730. (20% probability)
PRICE TARGETS
Timeframe: 62 days (target date Jan 2, 2027).
- Target Price: $672.00
- Expected Range: $610.00 to $748.00 (width $138 ≈ 20.0% of current price, consistent with the 61-180 day guidance of 18-30%)
- Key Levels: Support at $683.40 (EMA 200, then $678.37 SMA 200 and $662 Aug low), Resistance at $722.79 (EMA 50, with SMA 50 at $724.70)
OVERALL BIAS
OVERALL BIAS: BEARISH - Price has broken below the 50-day averages on heavy volume. MACD is below signal and zero, RSI is at 35, and −DI (45.1) dominates +DI (16.3) with ADX rising above 25. The long-term 200-day averages sit just below, so a bounce is possible, but the evidence favors a test or break of that support zone.
This is educational analysis and not financial advice.