TSLA 62-day bullish forecast — Nov 1, 2026
- Bias: Bullish
- Timeframe: 62 days (made Nov 1, 2026, target date Jan 1, 2027)
- Price at analysis: $399.81
- Price target: $424.00
- Expected range: $368.00 – $455.00
- Result: Pending — graded after the close on Jan 1, 2027
Get a free AI analysis of TSLA today
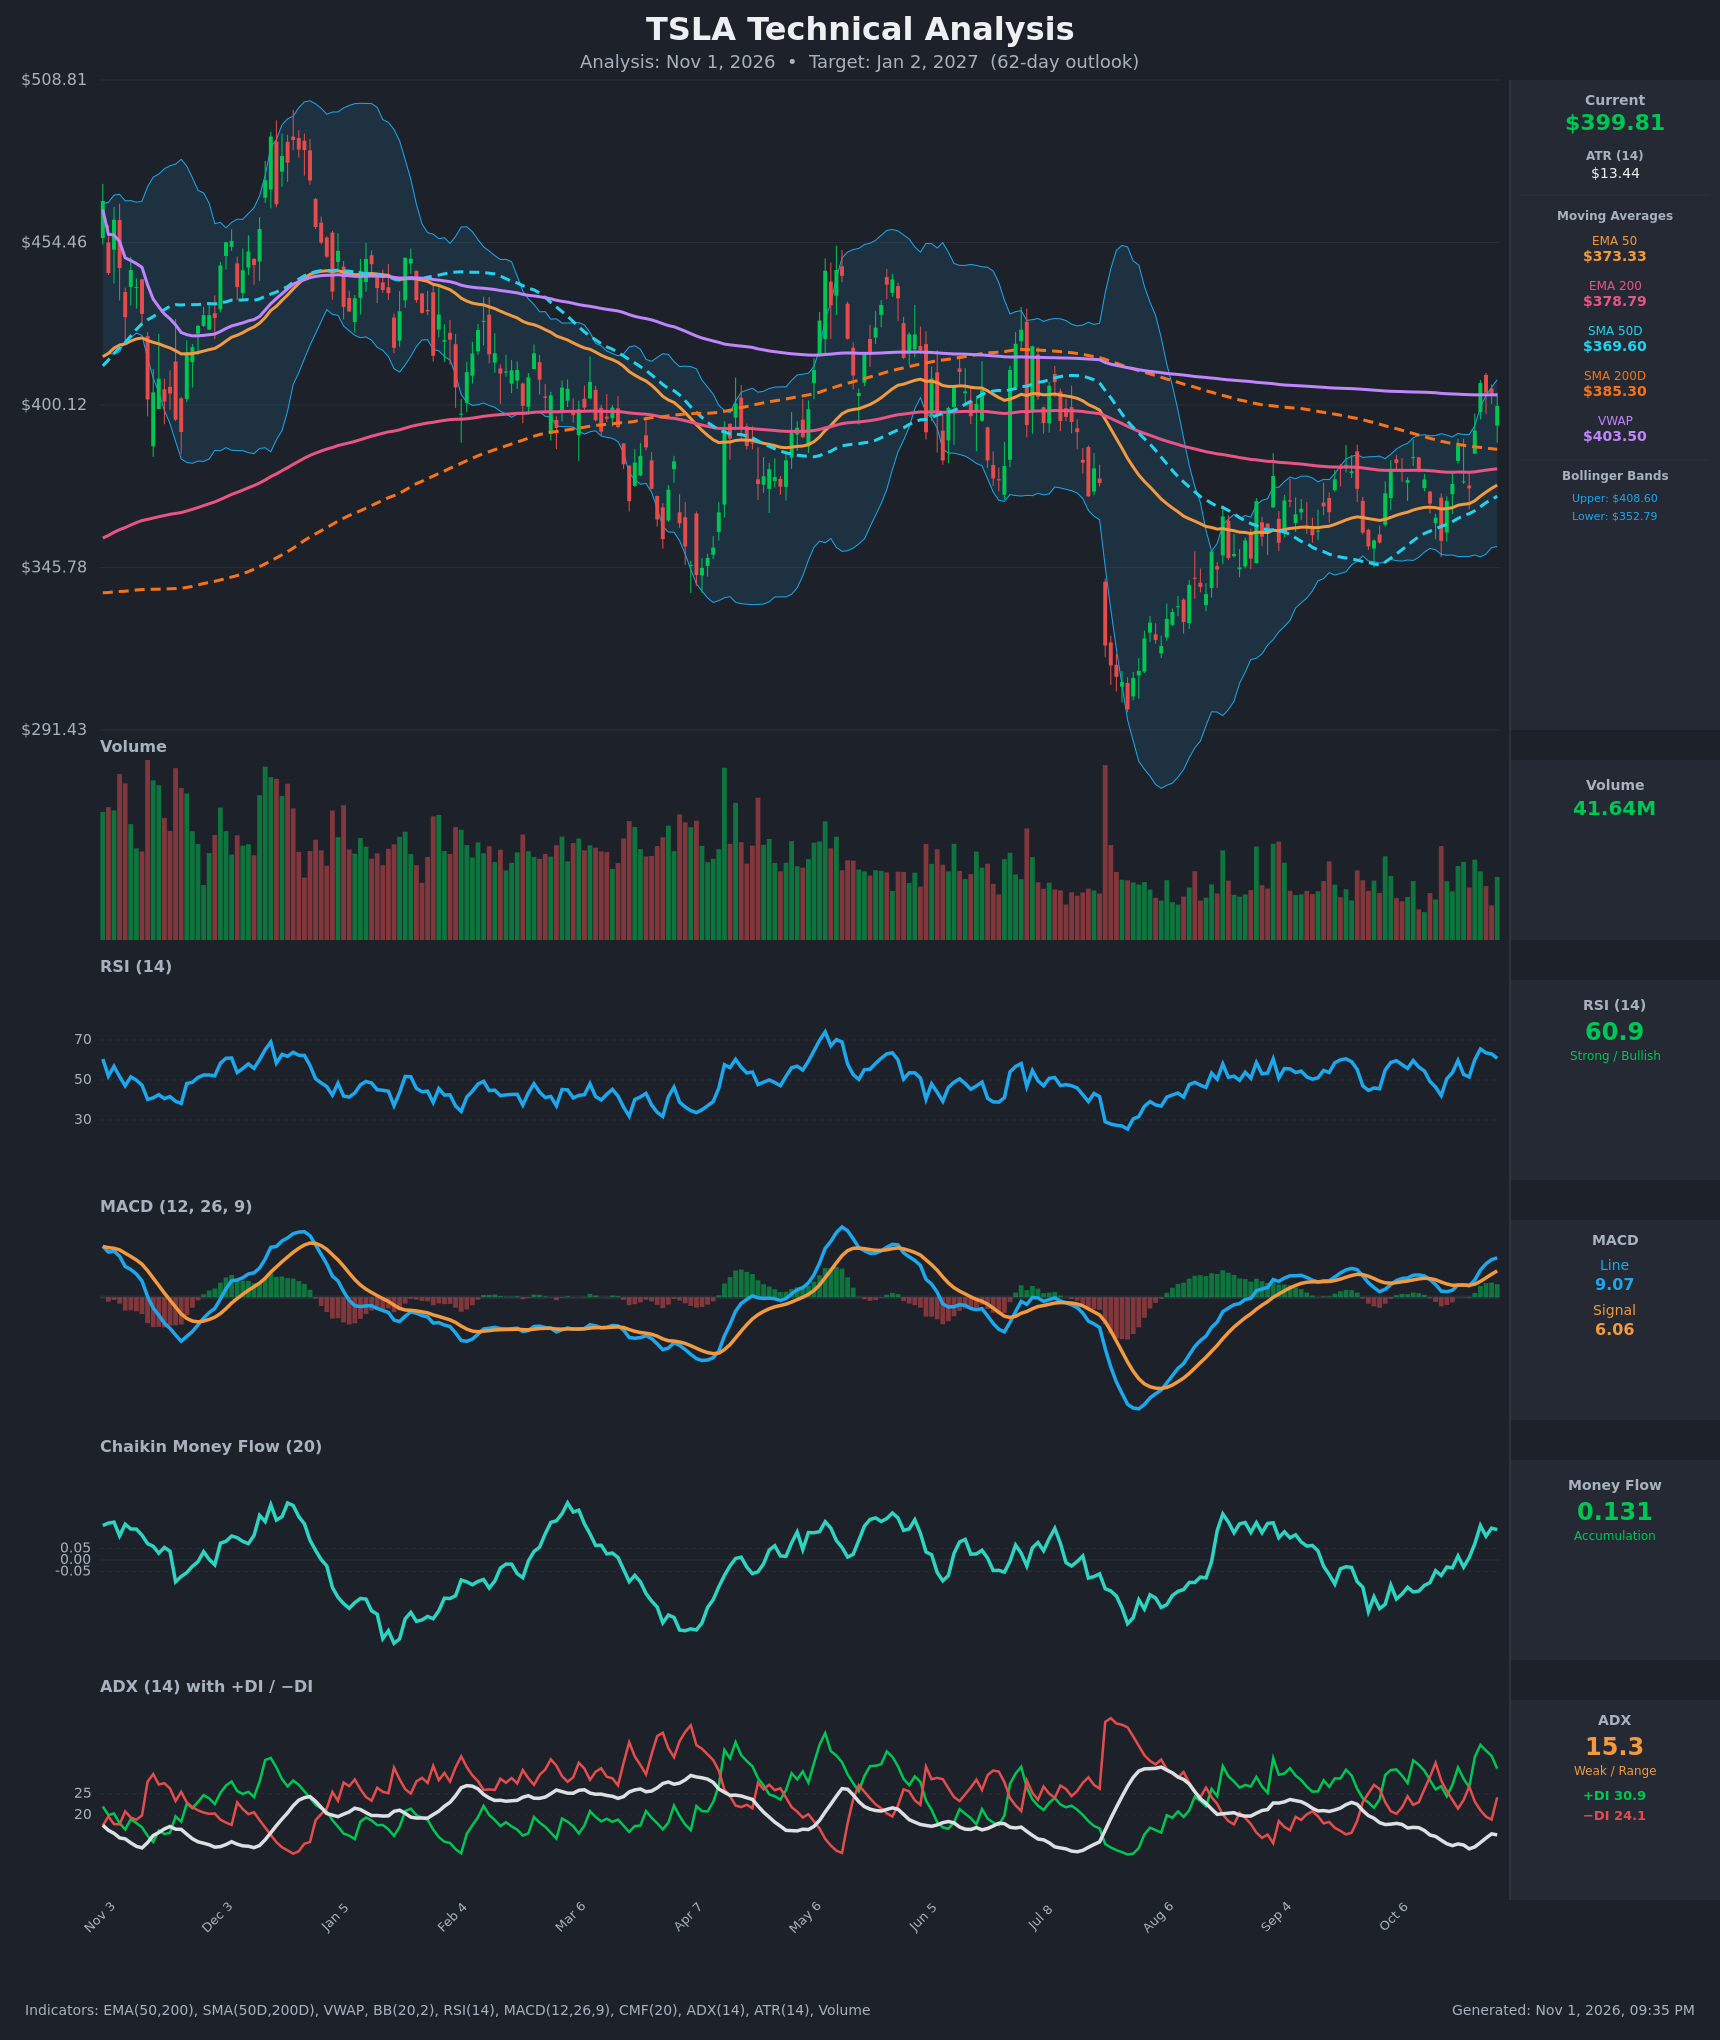
Analysis
TECHNICAL INDICATORS
- RSI (14): 60.86, up from 42 on Oct 16 and just below the 65.5 peak on Oct 27. Momentum is firmly positive but not overbought, so there is room to run. [Bullish]
- 20 EMA: Not supplied. The 50 EMA is $373.33 and rising, and price at $399.81 is about 7% above it. The 200 EMA at $378.79 has also been reclaimed, so both act as support on pullbacks. [Bullish]
- MACD: Line 9.07 is above signal 6.06 with a widening positive histogram. The bullish crossover occurred around Oct 21, and the line is at its highest in several weeks. [Bullish]
- Bollinger Bands (20): Upper $408.60, lower $352.79, so price sits in the upper quarter of the band (about 84% of the range). The bands are expanding after a squeeze, and the Oct 27 close of $407 was a test of the upper band. Near-term resistance is close, but a band walk is possible. [Bullish]
- CMF (20): +0.131, well above +0.05 and up from -0.135 on Oct 12. This is a clear shift to accumulation that confirms the breakout. [Accumulation]
- ADX (14): 15.3 with +DI 30.9 above −DI 24.1. The trend is weak, but bulls hold directional control. The ADX is only starting to turn up, so the breakout lacks trend confirmation. [Weak Trend, Bullish lean]
- Volume: 41.64M, below the multi-month average. The Oct 26–27 breakout candles had better participation, but the overall pickup is modest, so follow-through is not yet proven. [Neutral to mildly Bullish]
DIVERGENCES & TRENDS
- Divergences: There is no bearish RSI or MACD divergence. RSI and MACD are both rising with price, and CMF has turned positive in step.
- Moving averages: Price is above the SMA200D ($385.30) for the first time in months, which is a long-term bullish reclaim. The SMA50D ($369.60) is climbing toward the SMA200D, a gap of about $15.70, so a golden cross is plausible within weeks. The EMA50 ($373.33) is also closing on the EMA200 ($378.79), a gap of about $5.50.
- Trend: Price has made higher lows since the early-August low near $300, and the Sep–Oct range of roughly $345–$390 has broken to the upside.
- VWAP: Price sits just below VWAP ($403.50), and a close above it would confirm buyer control.
- Caution: The ADX is below 20, so the breakout could fail in a choppy market. Overhead supply sits at $430–$455 from the May and December highs.
CHART PATTERNS
- Bullish base/reversal: After the August plunge, price formed higher lows within a range that resembles a Bullish Falling Wedge or a Bullish Expanding Triangle resolving upward. The reference target for these patterns is a move back toward the start of the pattern, roughly $430–$450.
- Failure risk: The Oct 27 rejection near $407 resembles a short-term double-top attempt at $407 against the neckline near $372. A close below $372 would suggest a failed breakout, and that level is the key invalidation.
- Resistance zone: The $403–$409 cluster (VWAP and upper BB) is the immediate hurdle, followed by $430.
POTENTIAL SCENARIOS
- Scenario 1: Bullish Breakout Continuation — Price clears the VWAP/upper-band cluster and the SMA/EMA 50/200 crossovers confirm, pulling in trend followers as ADX rises above 20–25. Trigger: daily close above $409 on rising volume. Target: $430–$445. Invalidation: close below $385 (SMA200D). (50% probability)
- Scenario 2: Neutral Range Consolidation — Price stalls under $409 and chops between the SMA200D and the upper band while ADX stays weak. Trigger: repeated rejections at $403–$409 with flat volume. Target: $380–$410. Invalidation: close above $415 or below $370. (28% probability)
- Scenario 3: Bearish Failed Breakout — The move proves a bull trap, with price rolling back under the moving averages. Trigger: close below $372 (EMA50/neckline). Target: $350–$355, then the lower band area. Invalidation: close back above $409. (22% probability)
PRICE TARGETS
- Target Price: $424.00 (62-day, to about Jan 2, 2027)
- Expected Range: $368.00 to $455.00 (width $87, about 21.8% of current price, consistent with the 18–30% guidance for 61–180 days)
- Key Levels: Support at $385.30 (SMA200D), Resistance at $408.60 (upper Bollinger Band; next resistance $430)
OVERALL BIAS
OVERALL BIAS: BULLISH - Price has reclaimed the SMA200D and EMA200, MACD is bullish with a widening histogram, CMF shows accumulation, and +DI leads −DI. The main risks are the weak ADX and the nearby $403–$409 resistance, so conviction is moderate.
This is educational analysis and not financial advice.