SMCI 62-day bearish forecast — Nov 1, 2026
- Bias: Bearish
- Timeframe: 62 days (made Nov 1, 2026, target date Jan 1, 2027)
- Price at analysis: $32.95
- Price target: $30.50
- Expected range: $24.50 – $38.50
- Result: Pending — graded after the close on Jan 1, 2027
Get a free AI analysis of SMCI today
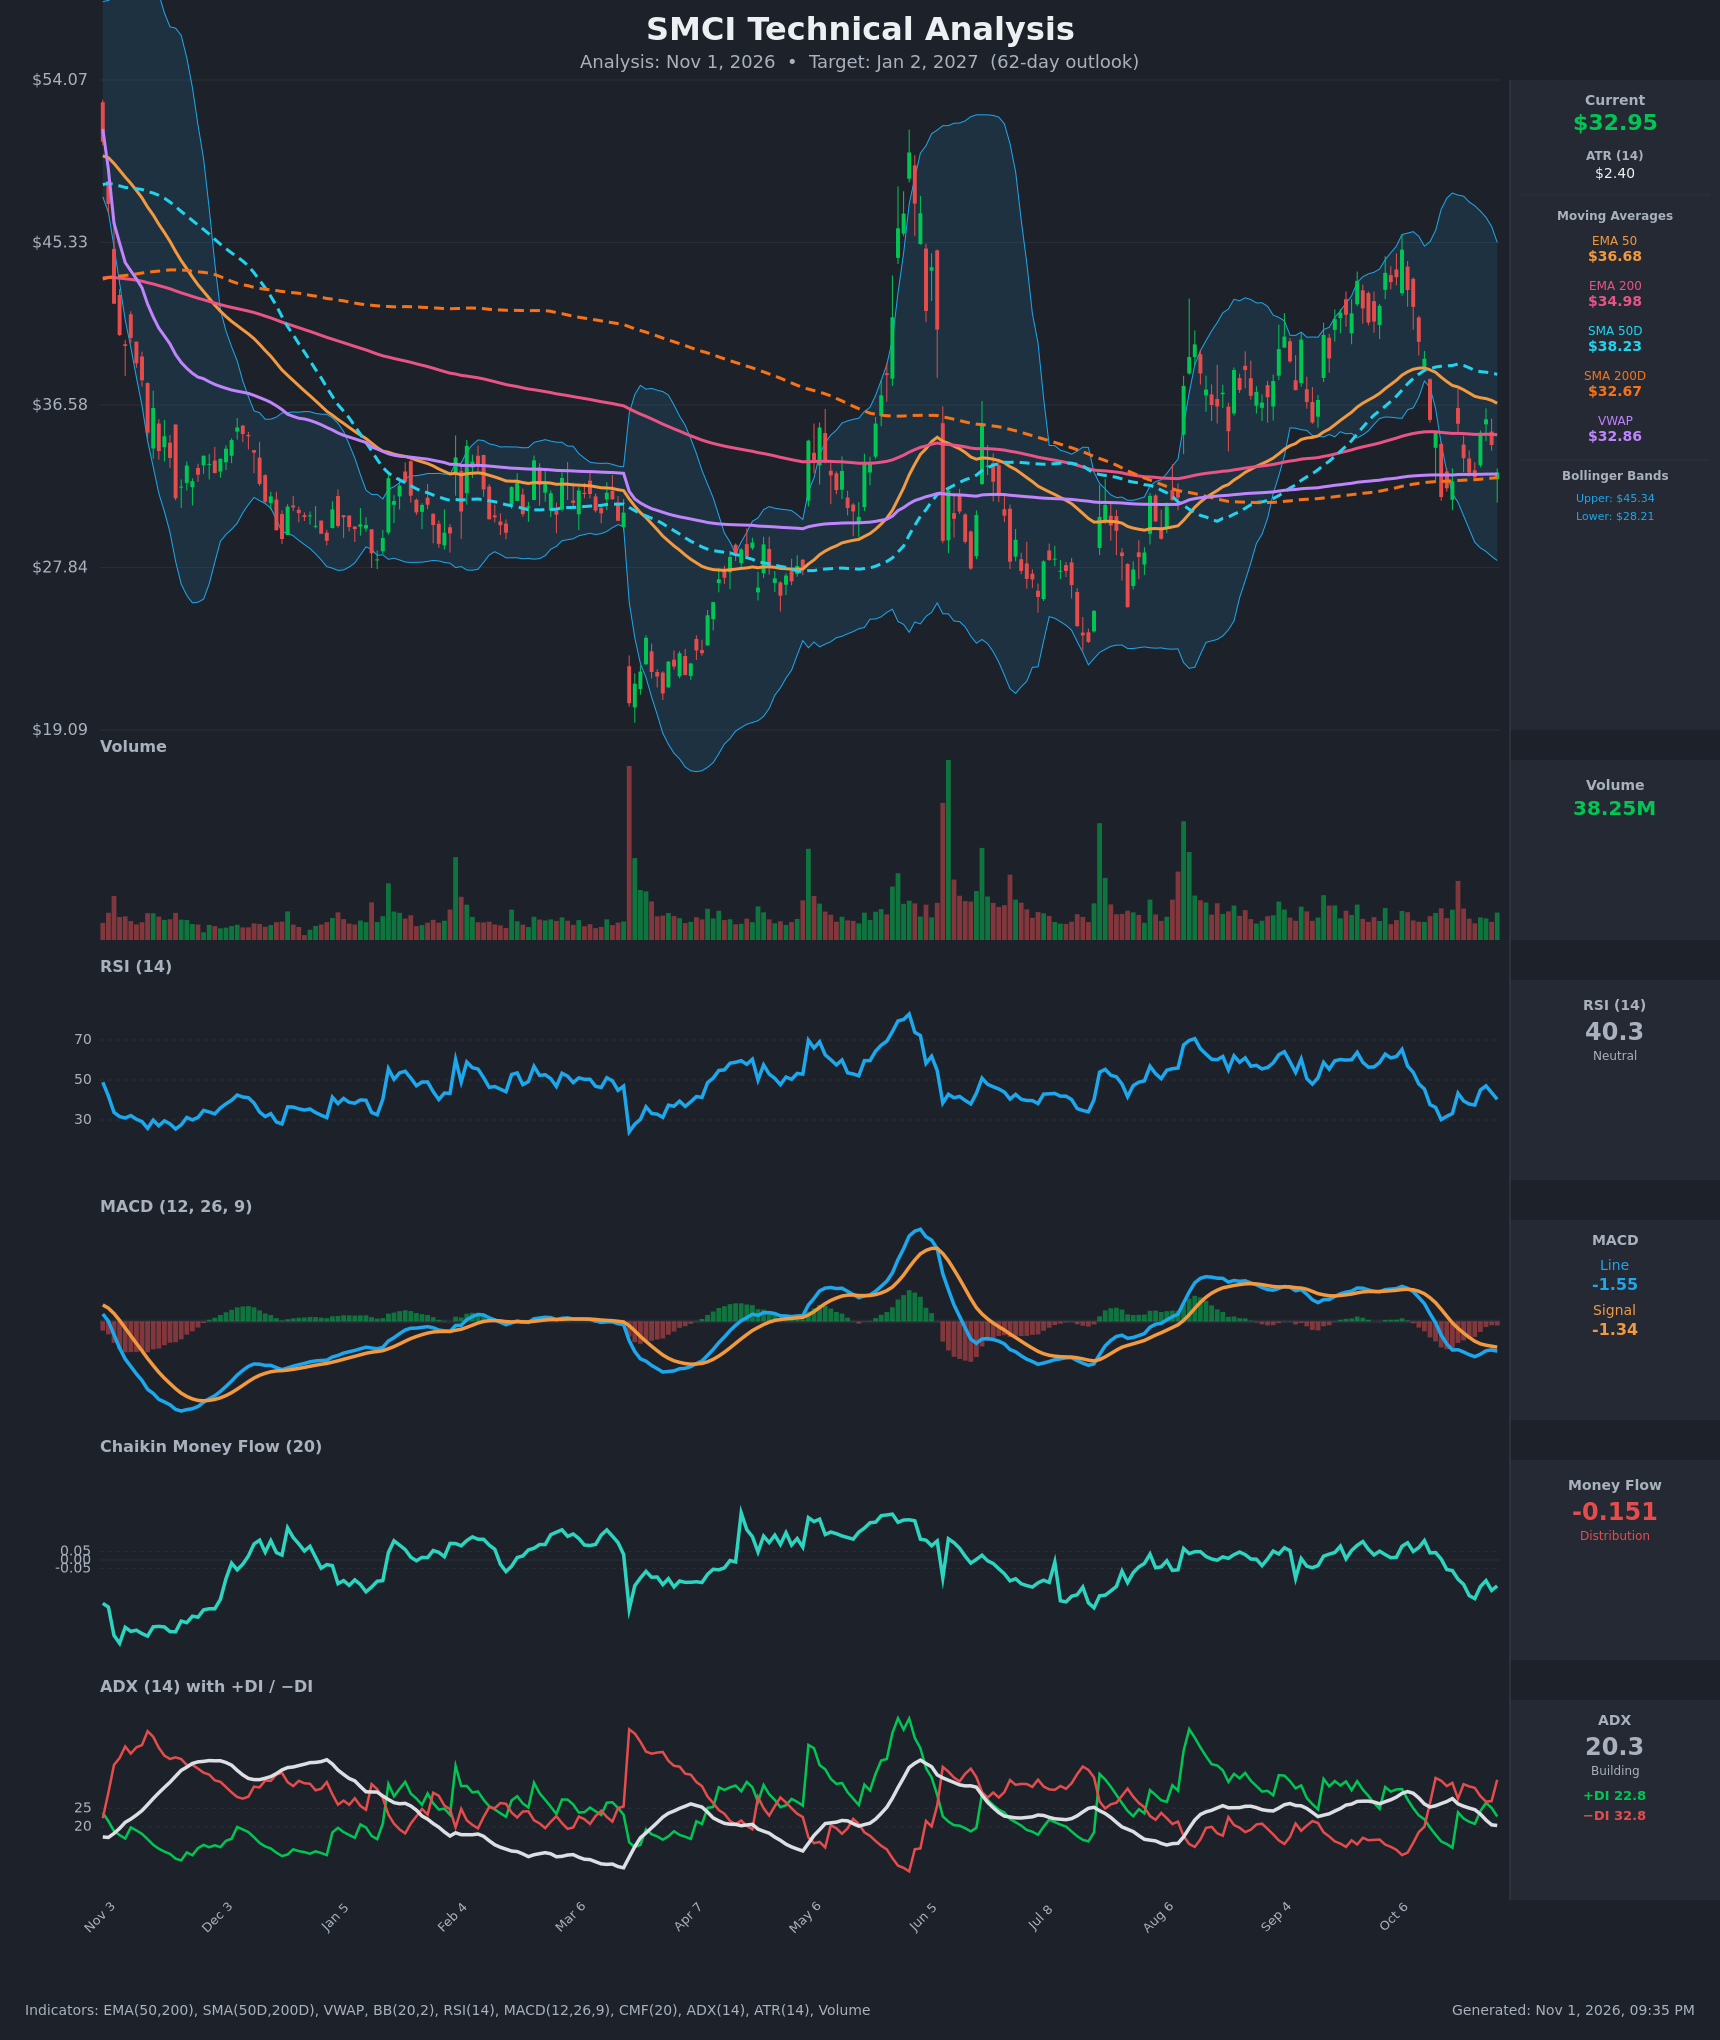
Analysis
TECHNICAL INDICATORS
- RSI (14): 40.35, below the 50 midline and recovering from a 30.2 low on Oct 16. The bounce has been choppy (43 → 47 → 40), with lower highs and no momentum follow-through. [Bearish]
- 20 EMA: The 20 EMA value was not supplied. The EMA 50 is $36.68 and falling (down from $38.58 on Oct 13). Price at $32.95 is about 10% below it, so it acts as overhead resistance. The EMA 200 at $34.98 is also above price and is also resistance. [Bearish]
- MACD: Line -1.55 is below the signal at -1.34, with a small negative histogram of about -0.21. The bearish crossover happened around Oct 20 and the line is still below zero. The gap has narrowed and widened again, so there is no bullish turn yet. [Bearish]
- Bollinger Bands (20): Upper $45.34, lower $28.21, midline about $36.8. Price is in the lower half, about 28% of the way up the band. The bands are wide, which reflects high volatility after the September-October swing to $45. Price sits below the midline, which is a mild negative. [Bearish]
- CMF (20): -0.151, well below -0.05 and falling from +0.11 on Oct 13. This is clear distribution. [Distribution]
- ADX (14): 20.3 and falling from 27.8, so the trend is losing strength. −DI at 32.8 is well above +DI at 22.8, so bears control direction, although the weak ADX means the downtrend lacks conviction. [Weak Trend, Bearish Direction]
- Volume: 38.25M, around or slightly above the recent average, with no large capitulation spike. Selling on the Oct 14-16 drop was heavier than the buying on the bounces. [Mildly Bearish]
DIVERGENCES & TRENDS
- No clear bullish RSI divergence. RSI made a low of 30.2 on Oct 16 at a price of $31.63. The retest near $32.9 has RSI at 40, which is higher than the prior lows. That is a mild improvement, but not a confirmed divergence.
- Moving averages:
- SMA50D ($38.23) is rolling over and is well above SMA200D ($32.67), so the golden-cross structure is intact but weakening.
- EMA50 ($36.68) is above EMA200 ($34.98), but the gap is narrowing quickly (from $3.46 to $1.70 over the last 15 bars). An EMA death cross is plausible within the forecast window.
- Price is just above SMA200D ($32.67) and VWAP ($32.86). This cluster of $32.6-$32.9 is the key long-term support.
- MACD: Bearish crossover on Oct 20, with the histogram negative and the line below zero.
- ADX/DI: The −DI crossover on Oct 14 has held, with brief reversals on Oct 27-28 that failed.
- CMF: The shift from accumulation to distribution matches the price drop from $45 to $33.
- Price action: Lower highs ($45 → ~$38 → ~$35.8) and a failed rebound at the EMA50. Price has been oscillating between $31.6 and $35.8 for two weeks.
CHART PATTERNS
- Bearish Head and Shoulders (loose): The ~$30 base in July-August was the left shoulder. The ~$45 peak in September-October was the head, and the current lower high near $35.8 is a potential right shoulder. The neckline sits near $31.6 (the Oct 16 low), with SMA200D at $32.67 just above it. A decisive break below $31.6 would give a measured target of roughly $18-$20, but that is too far for this window. Treat this as a partial pattern, since the shoulders are uneven.
- Descending/Symmetrical Triangle (developing): Lower highs at $35.8-$36 against flat support at $31.6-$32. A breakdown is a bearish continuation, and the weak ADX fits the compression.
- Bearish bias in the diagram: The Bearish Double Top / Head and Shoulders reference patterns apply, with a measured move toward the $27-$28 range, roughly the lower Bollinger Band and prior support.
POTENTIAL SCENARIOS
- Scenario 1: Bearish Breakdown Below SMA200D — Distribution, −DI dominance, and a bearish MACD push price below the $31.6 neckline and the SMA200D/VWAP cluster. Trigger: Daily close below $31.60 on rising volume. Target: $27.50-$28.50 (lower Bollinger Band, prior support), with an extension to about $26. Invalidation: Daily close above $36.70 (EMA50). (50% probability)
- Scenario 2: Neutral Range Chop — Price stays between SMA200D support at $32.67 and EMA50 resistance at $36.7, with weak ADX keeping it contained. Trigger: Repeated holds of $31.6-$32.7. Target: $31-$36. Invalidation: Close outside $30.50-$37.50. (20% probability)
- Scenario 3: Bullish Reclaim of the Moving Averages — Price bounces off the SMA200D/VWAP cluster, reclaims EMA200 ($35), and then pushes to EMA50 and SMA50D. This needs a MACD recross and CMF turning positive. Trigger: Close above $35.00-$36.70 with CMF back above 0. Target: $38-$41. Invalidation: Close below $31.60. (30% probability)
PRICE TARGETS
- Target Price: $30.50 (62-day, Jan 2, 2027)
- Expected Range: $24.50 to $38.50. This is a $14.00 width, about 42.5% of the current price. That is wider than the 18-30% guideline for 61-180 days, because ATR is about 7% of price and realized volatility is very high. For a strict fit to guidance, the core range is about $26.50 to $36.00 (28.8%).
- Key Levels: Support at $31.60 (Oct 16 low, with SMA200D at $32.67 just above it), Resistance at $36.68 (EMA50)
OVERALL BIAS
OVERALL BIAS: BEARISH - CMF shows clear distribution, −DI dominates, MACD is below its signal and zero, and price sits below both the EMA50 and EMA200 with lower highs. A break of the $31.6-$32.7 support cluster would open the way toward $27-$28. A weak ADX and a possible bounce from SMA200D limit conviction, so the target is only modestly below the current price.
This is educational analysis and not financial advice.