XLE 62-day bullish forecast — Nov 1, 2026
- Bias: Bullish
- Timeframe: 62 days (made Nov 1, 2026, target date Jan 1, 2027)
- Price at analysis: $70.02
- Price target: $73.00
- Expected range: $62.00 – $79.50
- Result: Pending — graded after the close on Jan 1, 2027
Get a free AI analysis of XLE today
Analysis
TECHNICAL INDICATORS
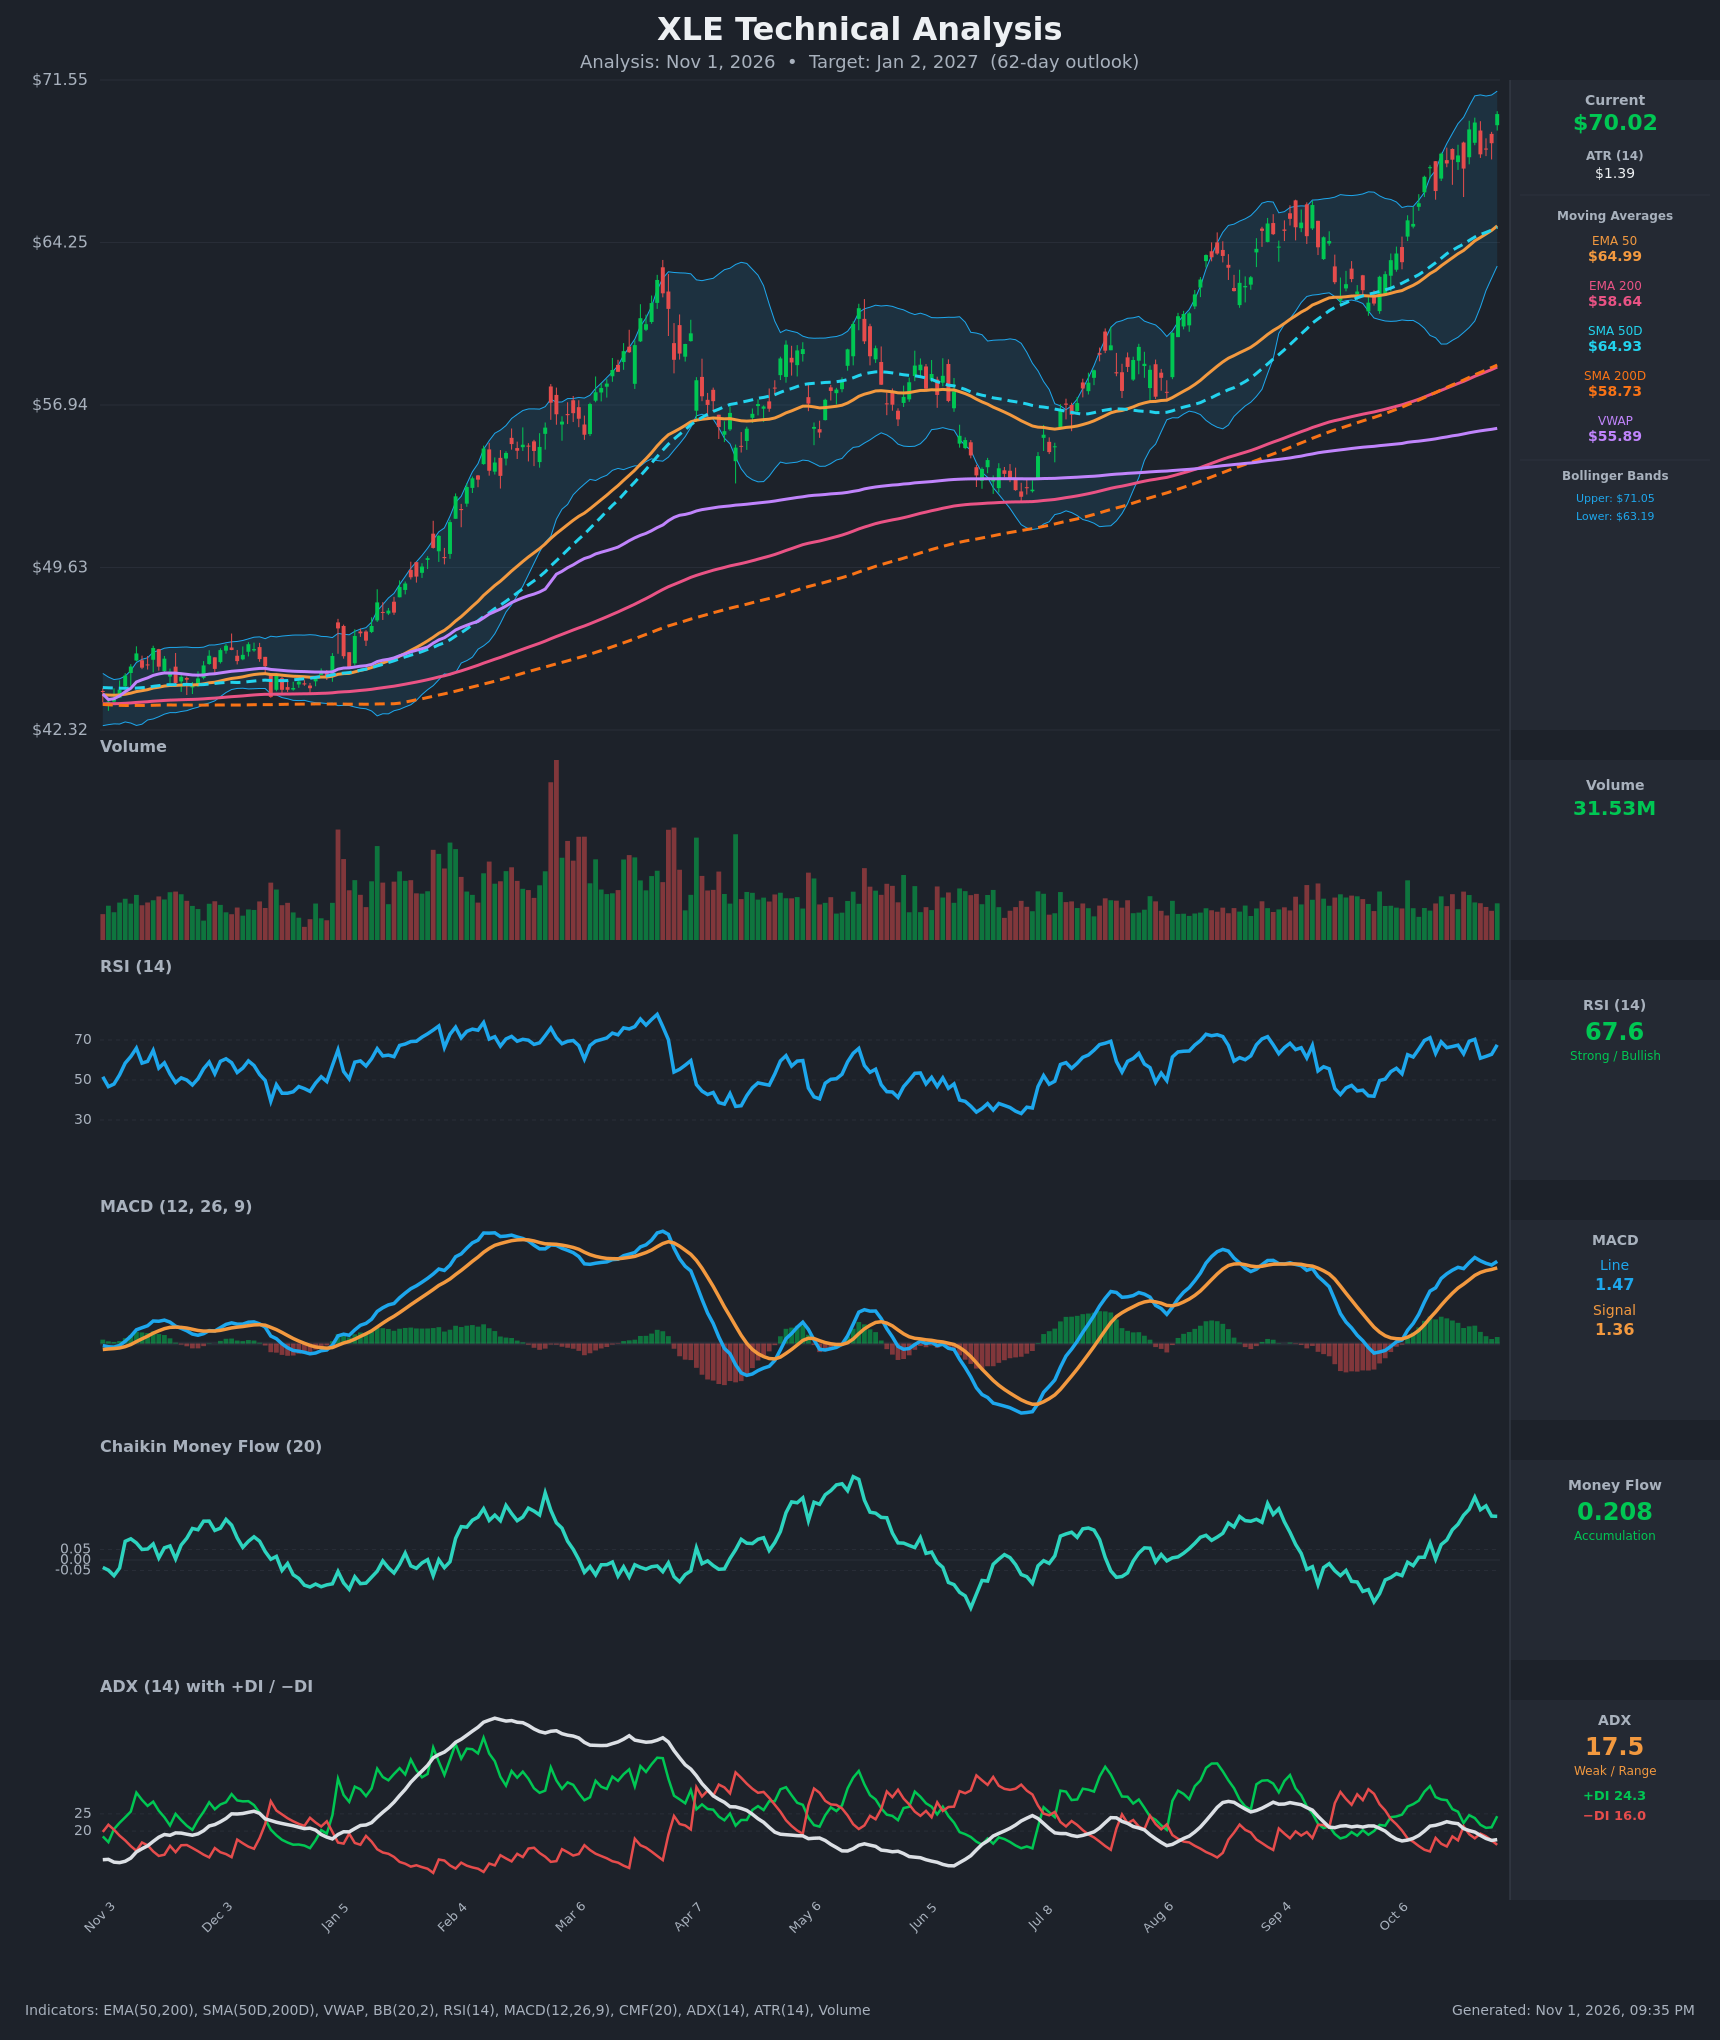
- RSI (14): 67.58, just under the 70 overbought line. It has oscillated between 61 and 71 over the last 15 bars, so momentum is strong but near exhaustion. Prior RSI peaks near 70 on the chart (Mar, Aug) were followed by pullbacks. [Bullish]
- 20 EMA: Not supplied. The EMA 50 is $64.99 and the SMA 50 is $64.93, both rising, and price is about 7.7% above them. Price has held above the short-term trend through the whole October advance. The extension raises the odds of a pullback toward them. [Bullish]
- MACD: Line 1.473 is above signal 1.357, with a small positive histogram (+0.12). The line is back above the signal after a mild dip on Oct 27-29, but the histogram is shrinking compared with Oct 26 (0.32). Momentum is positive but not accelerating. [Bullish]
- Bollinger Bands (20): Upper $71.05, lower $63.19, with price at $70.02 in the top ~13% of the band. The bands have been widening, and price has been walking the upper half. That is a trend-strength signal, but it is also near the point where past rallies stalled. [Bullish]
- CMF (20): 0.208, well above +0.05 and the highest reading in months. It has been positive and rising since Oct 14, so accumulation is strong and supports the rally. [Accumulation]
- ADX (14): 17.5 and falling from 22.7, below 20. +DI is 24.3 and −DI is 16.0, so bulls are on top. The trend is directionally up but lacks strength, which suggests grinding rather than explosive gains. [Weak Trend + Bullish direction]
- Volume: 31.53M, average to slightly below average, with no volume surge on the push to new highs. Volume is not confirming the breakout strongly. [Neutral]
Long-term structure is bullish. Price is above the SMA 200 ($58.73) and above VWAP ($55.89). The EMA 50 is above the EMA 200, and the SMA 50 is above the SMA 200. That golden cross has been in place for months, and both 200-period averages are still rising.
DIVERGENCES & TRENDS
- No bearish RSI divergence: Price made a new high at $70.02 and RSI rose from 61 to 67.6, but RSI is below the 71 peak of Oct 14. This is a mild lack of confirmation, not a true divergence.
- MACD: It is above the signal line, but the histogram is narrower than at its Oct 26 peak. MACD peaks are higher than in Aug, which is constructive.
- CMF: It is making higher highs along with price, a healthy confirmation.
- ADX: It is declining while price rises, indicating a low-momentum grind higher. A +DI/−DI near-crossover occurred on Oct 22-29 and resolved bullishly.
- Trend: Higher highs and higher lows since the early-July low near $53. All moving averages are stacked bullishly: price > EMA 50 ≈ SMA 50 > EMA 200 ≈ SMA 200 > VWAP.
CHART PATTERNS
- The chart shows a rising channel / staircase uptrend from July. Price broke above the Aug-Sep consolidation highs near $66, a base-and-breakout. From the reference diagram, the closest fit is a bullish flag/continuation structure: a sharp rally, then a tight pause between roughly $66 and $70. A breakout above $71 would project a measured move of roughly $73-75.
- No confirmed reversal pattern (double top, head and shoulders) is present. A failed push at $70-71 followed by a break below $66 would start to resemble a double top, with a target near the EMA 50 at $65 and then $62.
- Price is pressing against the upper Bollinger Band at a prior-high zone, so a pause or retest is plausible.
POTENTIAL SCENARIOS
- Scenario 1: Bullish Trend Continuation — Price breaks above the upper Bollinger Band and the $71 area, with CMF staying positive and the EMA 50 rising as support. Trend followers add on shallow pullbacks. Trigger: daily close above $71.05 with MACD holding above signal. Target: $73-76. Invalidation: close below $66.50. (50% probability)
- Scenario 2: Bearish Mean-Reversion Pullback — Price is stretched ~8% above the EMA 50 with RSI near 70 and weak ADX. It rolls over and retraces toward the 50-day averages, and a double-top shape forms. Trigger: rejection at $70-71 followed by a close below $67.50 and a bearish MACD cross. Target: $64.50-65.50. Invalidation: close above $71.50. (30% probability)
- Scenario 3: Neutral Consolidation — Price chops between $65 and $71 while the moving averages catch up, ADX stays below 20, and price ends near current levels. Trigger: failure to break $71 or $66 for several weeks. Target: $68-71. Invalidation: close outside the $64.50-$72 range. (20% probability)
PRICE TARGETS
- Target Price: $73.00 (62 days, around Jan 2, 2027)
- Expected Range: $62.00 to $79.50 (width $17.50, about 25% of the current price, consistent with the 61-180 day guidance)
- Key Levels: Support at $67.50 (recent consolidation low; stronger support at the $64.99 EMA 50), Resistance at $71.05 (upper Bollinger Band; next resistance near $75)
OVERALL BIAS
OVERALL BIAS: BULLISH - A fully stacked bullish moving-average structure, positive MACD, strong CMF accumulation (0.208) and +DI above −DI favor further upside. Conviction is modest because price is extended near the upper Bollinger Band with RSI near 70, weak ADX and unremarkable volume, so pullbacks along the way are likely.
This is educational analysis and not financial advice.