TLT 62-day bullish forecast — Nov 1, 2026
- Bias: Bullish
- Timeframe: 62 days (made Nov 1, 2026, target date Jan 1, 2027)
- Price at analysis: $81.84
- Price target: $83.20
- Expected range: $74.50 – $89.50
- Result: Pending — graded after the close on Jan 1, 2027
Get a free AI analysis of TLT today
Analysis
TECHNICAL INDICATORS
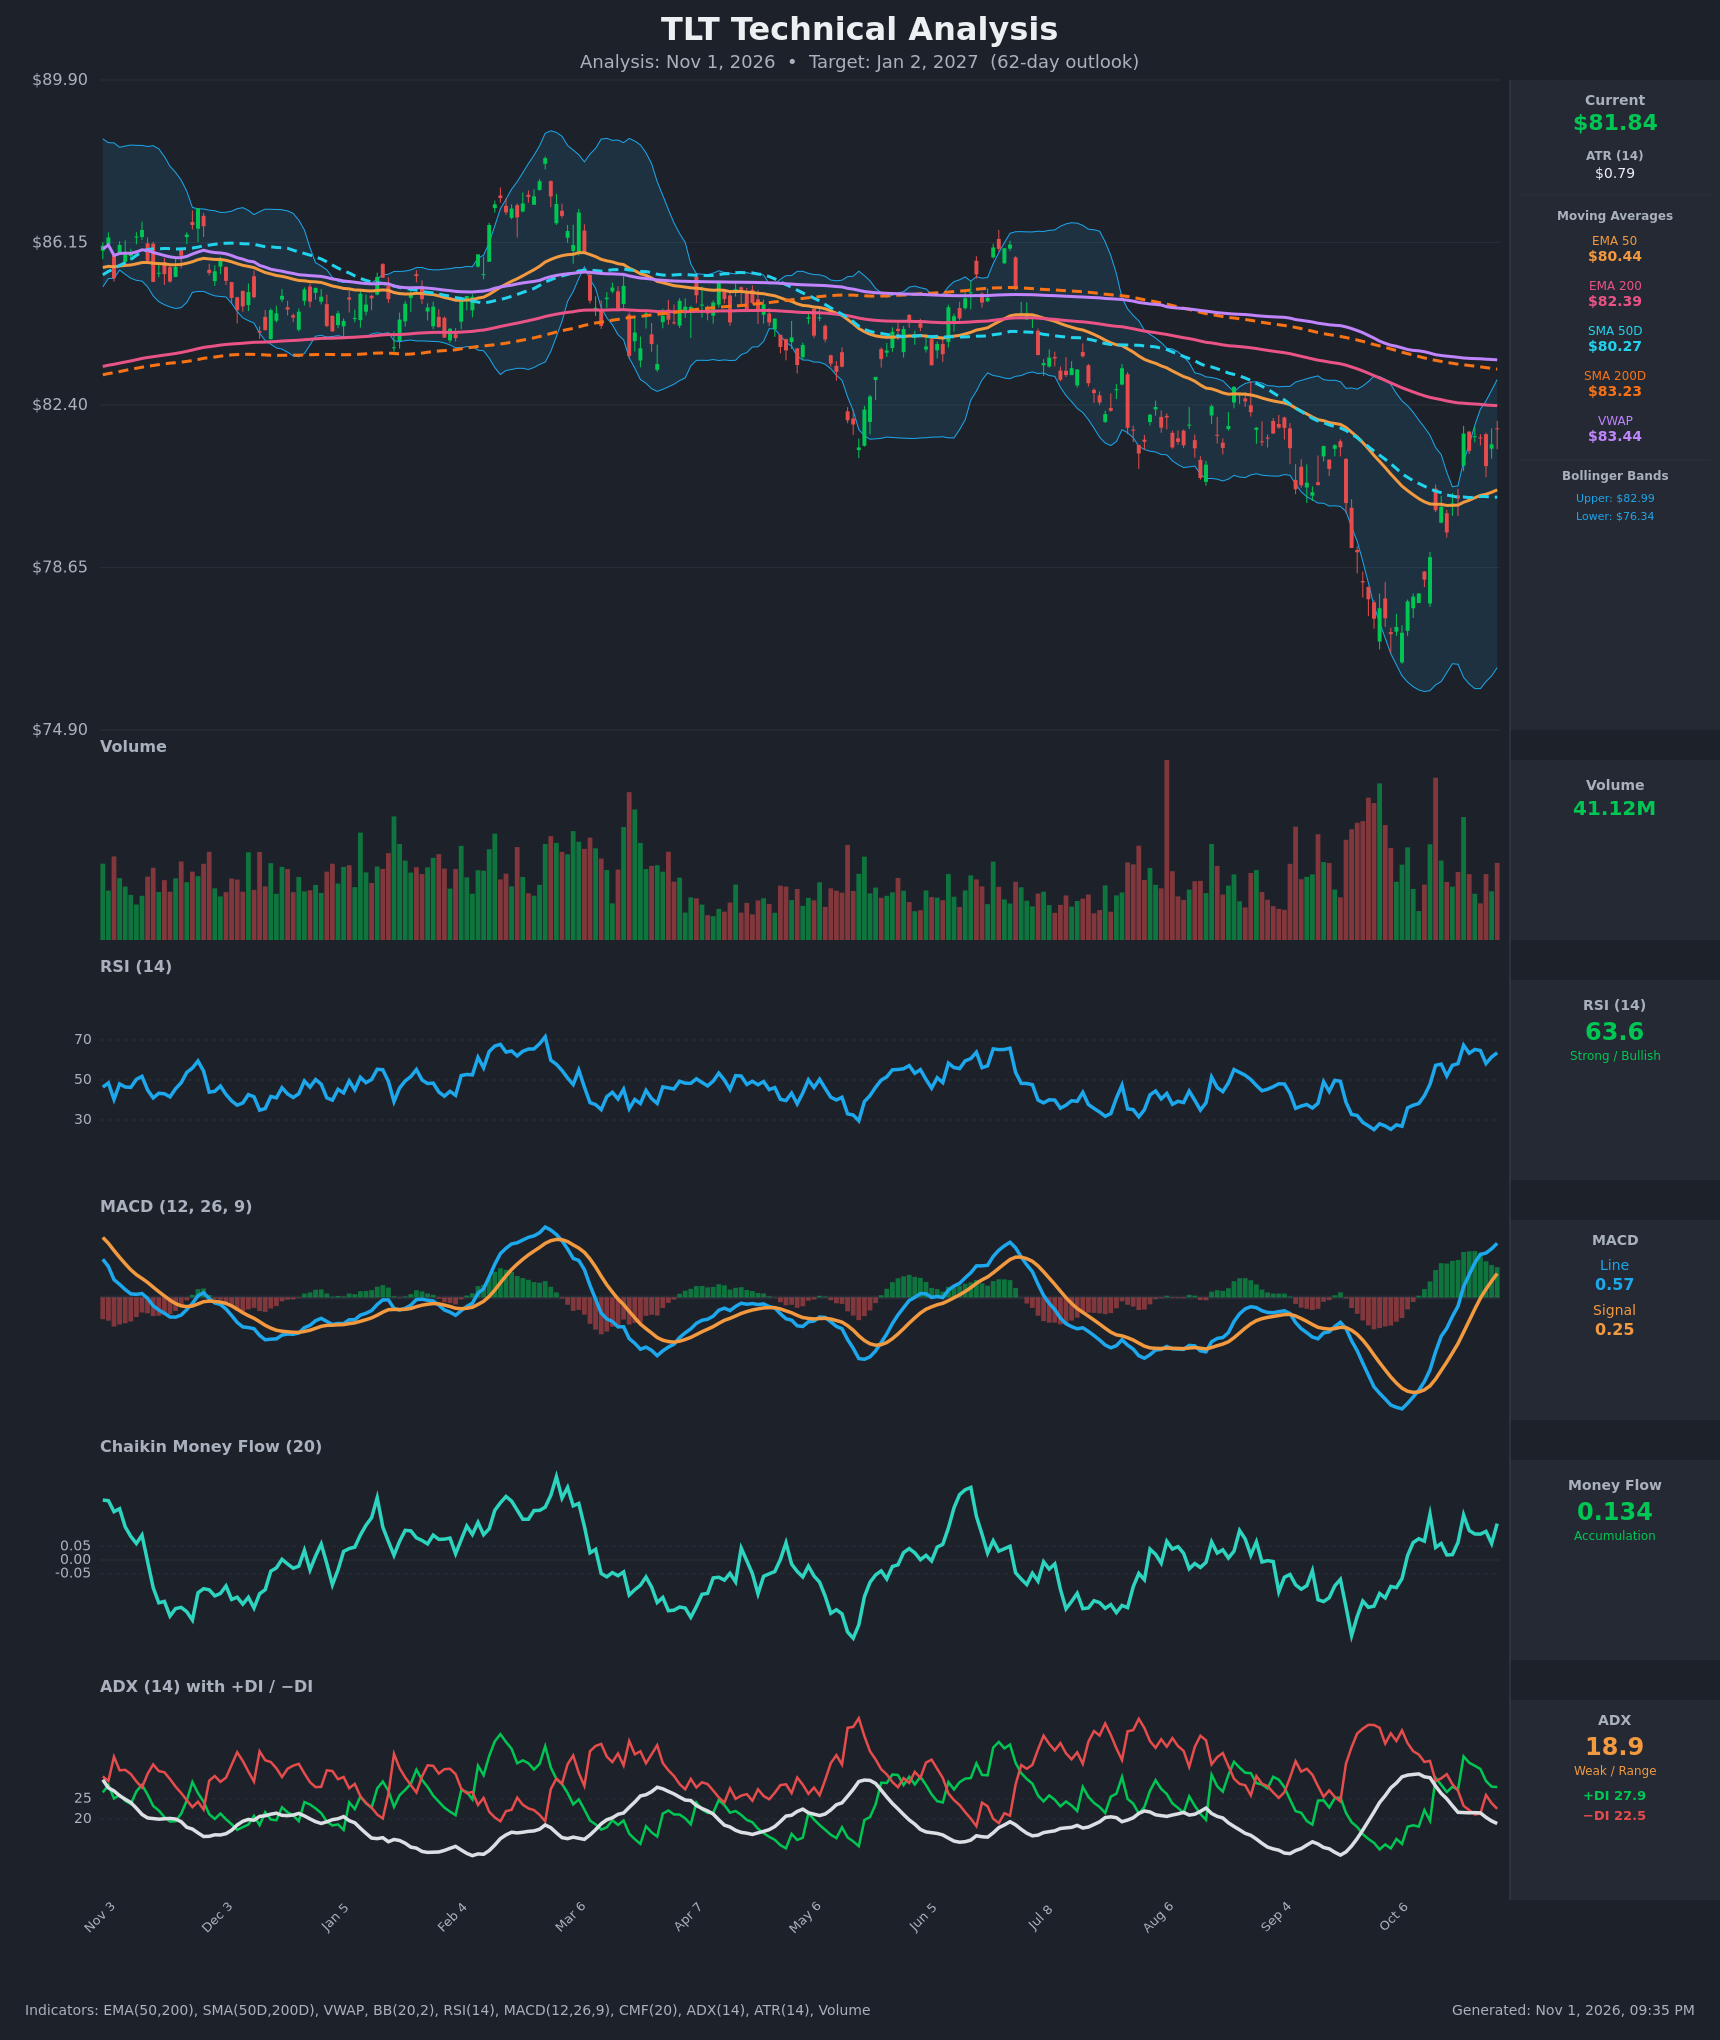
- RSI (14): 63.63, up from about 38 on Oct 12 and a trough in the mid-20s on the chart. It peaked near 67 on Oct 22 and is holding in the 58-67 zone. Momentum is strong but not yet overbought. [Bullish]
- 20 EMA: No 20 EMA value was provided. The EMA 50 ($80.44) is rising slowly and price ($81.84) is about 1.7% above it, so it now acts as first support. Price also sits above the SMA 50 ($80.27). [Bullish]
- MACD: Line 0.571 is above Signal 0.252. It crossed up on Oct 22 and the histogram is positive and expanding at about +0.32. The line has risen from -0.98 to positive territory. [Bullish]
- Bollinger Bands (20): Upper $82.99, lower $76.34, midline about $79.66. Price rebounded from the lower band and now trades in the upper half, about $1.15 below the upper band. The bands are still wide after the late-September/October selloff, so volatility is elevated. [Bullish]
- CMF (20): 0.134, well above the +0.05 threshold. It has been positive throughout the rebound, which points to accumulation. [Accumulation]
- ADX (14): 18.9 and falling from 31 (below 20, so range-bound or weak). +DI 27.9 is above −DI 22.5, so bulls have a modest edge. The prior downtrend has lost strength but no new strong uptrend has formed. [Weak Trend, Bullish lean]
- Volume: 41.12M, around the average with no recent climactic spike. The big volume bursts came on the late-Sept/early-Oct capitulation lows, and green-bar volume has been decent during the bounce. This suggests the selling climax is behind it, though the bounce has not yet been confirmed by surging volume. [Mildly Supportive]
DIVERGENCES & TRENDS
- Price made a deep low (about $76.5) in early October while RSI and CMF were depressed. Both have since recovered sharply, and the MACD low was a clear V-shaped turn. The earlier lows in May and June also had a bullish turn in momentum.
- The MACD bullish crossover on Oct 22 was confirmed by +DI crossing above −DI on Oct 15 and again on Oct 22. RSI reclaimed 50 on Oct 15.
- The longer-term structure is still bearish. EMA50 ($80.44) is below EMA200 ($82.39) and SMA50 ($80.27) is below SMA200 ($83.23), a death-cross configuration. Price is below SMA200, EMA200 and VWAP ($83.44).
- A cluster of resistance sits between $82.39 and $83.44, just overhead.
- ADX has dropped from 31 to 18.9. The downtrend has exhausted and the market is shifting from trend to transition, so follow-through is not guaranteed.
CHART PATTERNS
- Bullish Falling Wedge / descending channel breakout: From the summer highs, price formed lower highs and lower lows inside a descending channel. The sharp October reversal pushed price back above the channel's upper boundary and above the EMA50 and SMA50. The measured target is the channel start, around $85-86. A more conservative first target is the $83.0-83.4 resistance cluster (SMA200 and VWAP).
- V-shaped reversal: This is a capitulation-type bottom. These often retest the breakout zone ($80-80.5) before continuing.
- The bearish risk is that this proves to be a bear-market rally. The failed rallies at $85 in June and July and the declining 200-day averages show sellers defending higher levels.
POTENTIAL SCENARIOS
- Scenario 1: Bullish Reversal Extension — Price holds the $80.3-80.5 EMA50/SMA50 area, pushes through the $82.4-83.4 resistance cluster, and builds toward the upper part of the old channel. Trigger: daily close above $83.25 (SMA200) on rising volume with MACD staying positive. Target: $83.50-$85.50. Invalidation: daily close below $79.50. (50% probability)
- Scenario 2: Bearish Rejection at Long-Term Resistance — The rebound stalls at the EMA200, SMA200 and VWAP cluster and fades back, retesting or breaking the October lows as the weak ADX fails to produce a new uptrend. Trigger: rejection at $82.4-83.4 and a close below $80.27. Target: $77.50-$78.50. Invalidation: close above $83.50. (33% probability)
- Scenario 3: Neutral Range Consolidation — Price chops between $80 and $83 as the moving averages converge. Trigger: ADX stays below 20 and price oscillates around the 50-day averages. Target: $80.50-$83.00. Invalidation: close outside $79.50-$83.50. (17% probability)
PRICE TARGETS
- Target Price: $83.20 (62 days, Jan 2, 2027)
- Expected Range: $74.50 to $89.50 (width $15.00, about 18.3% of current price, consistent with the 61-180 day guidance)
- Key Levels: Support at $80.27 (SMA50, with EMA50 at $80.44 just above it), Resistance at $82.39 (EMA200, with SMA200 at $83.23 and VWAP at $83.44 just above)
OVERALL BIAS
OVERALL BIAS: BULLISH - Momentum has turned decisively, with a MACD bullish crossover, RSI above 60, positive CMF accumulation, +DI above −DI, and price reclaiming the 50-day averages after a capitulation low. The upside is capped by the overhead $82.4-83.4 resistance cluster, so conviction is moderate.
This is educational analysis and not financial advice.