BAC 76-day bullish forecast — Nov 1, 2026
- Bias: Bullish
- Timeframe: 76 days (made Nov 1, 2026, target date Jan 15, 2027)
- Price at analysis: $50.01
- Price target: $53.20
- Expected range: $46.60 – $57.00
- Result: Pending — graded after the close on Jan 15, 2027
Get a free AI analysis of BAC today
Analysis
TECHNICAL INDICATORS
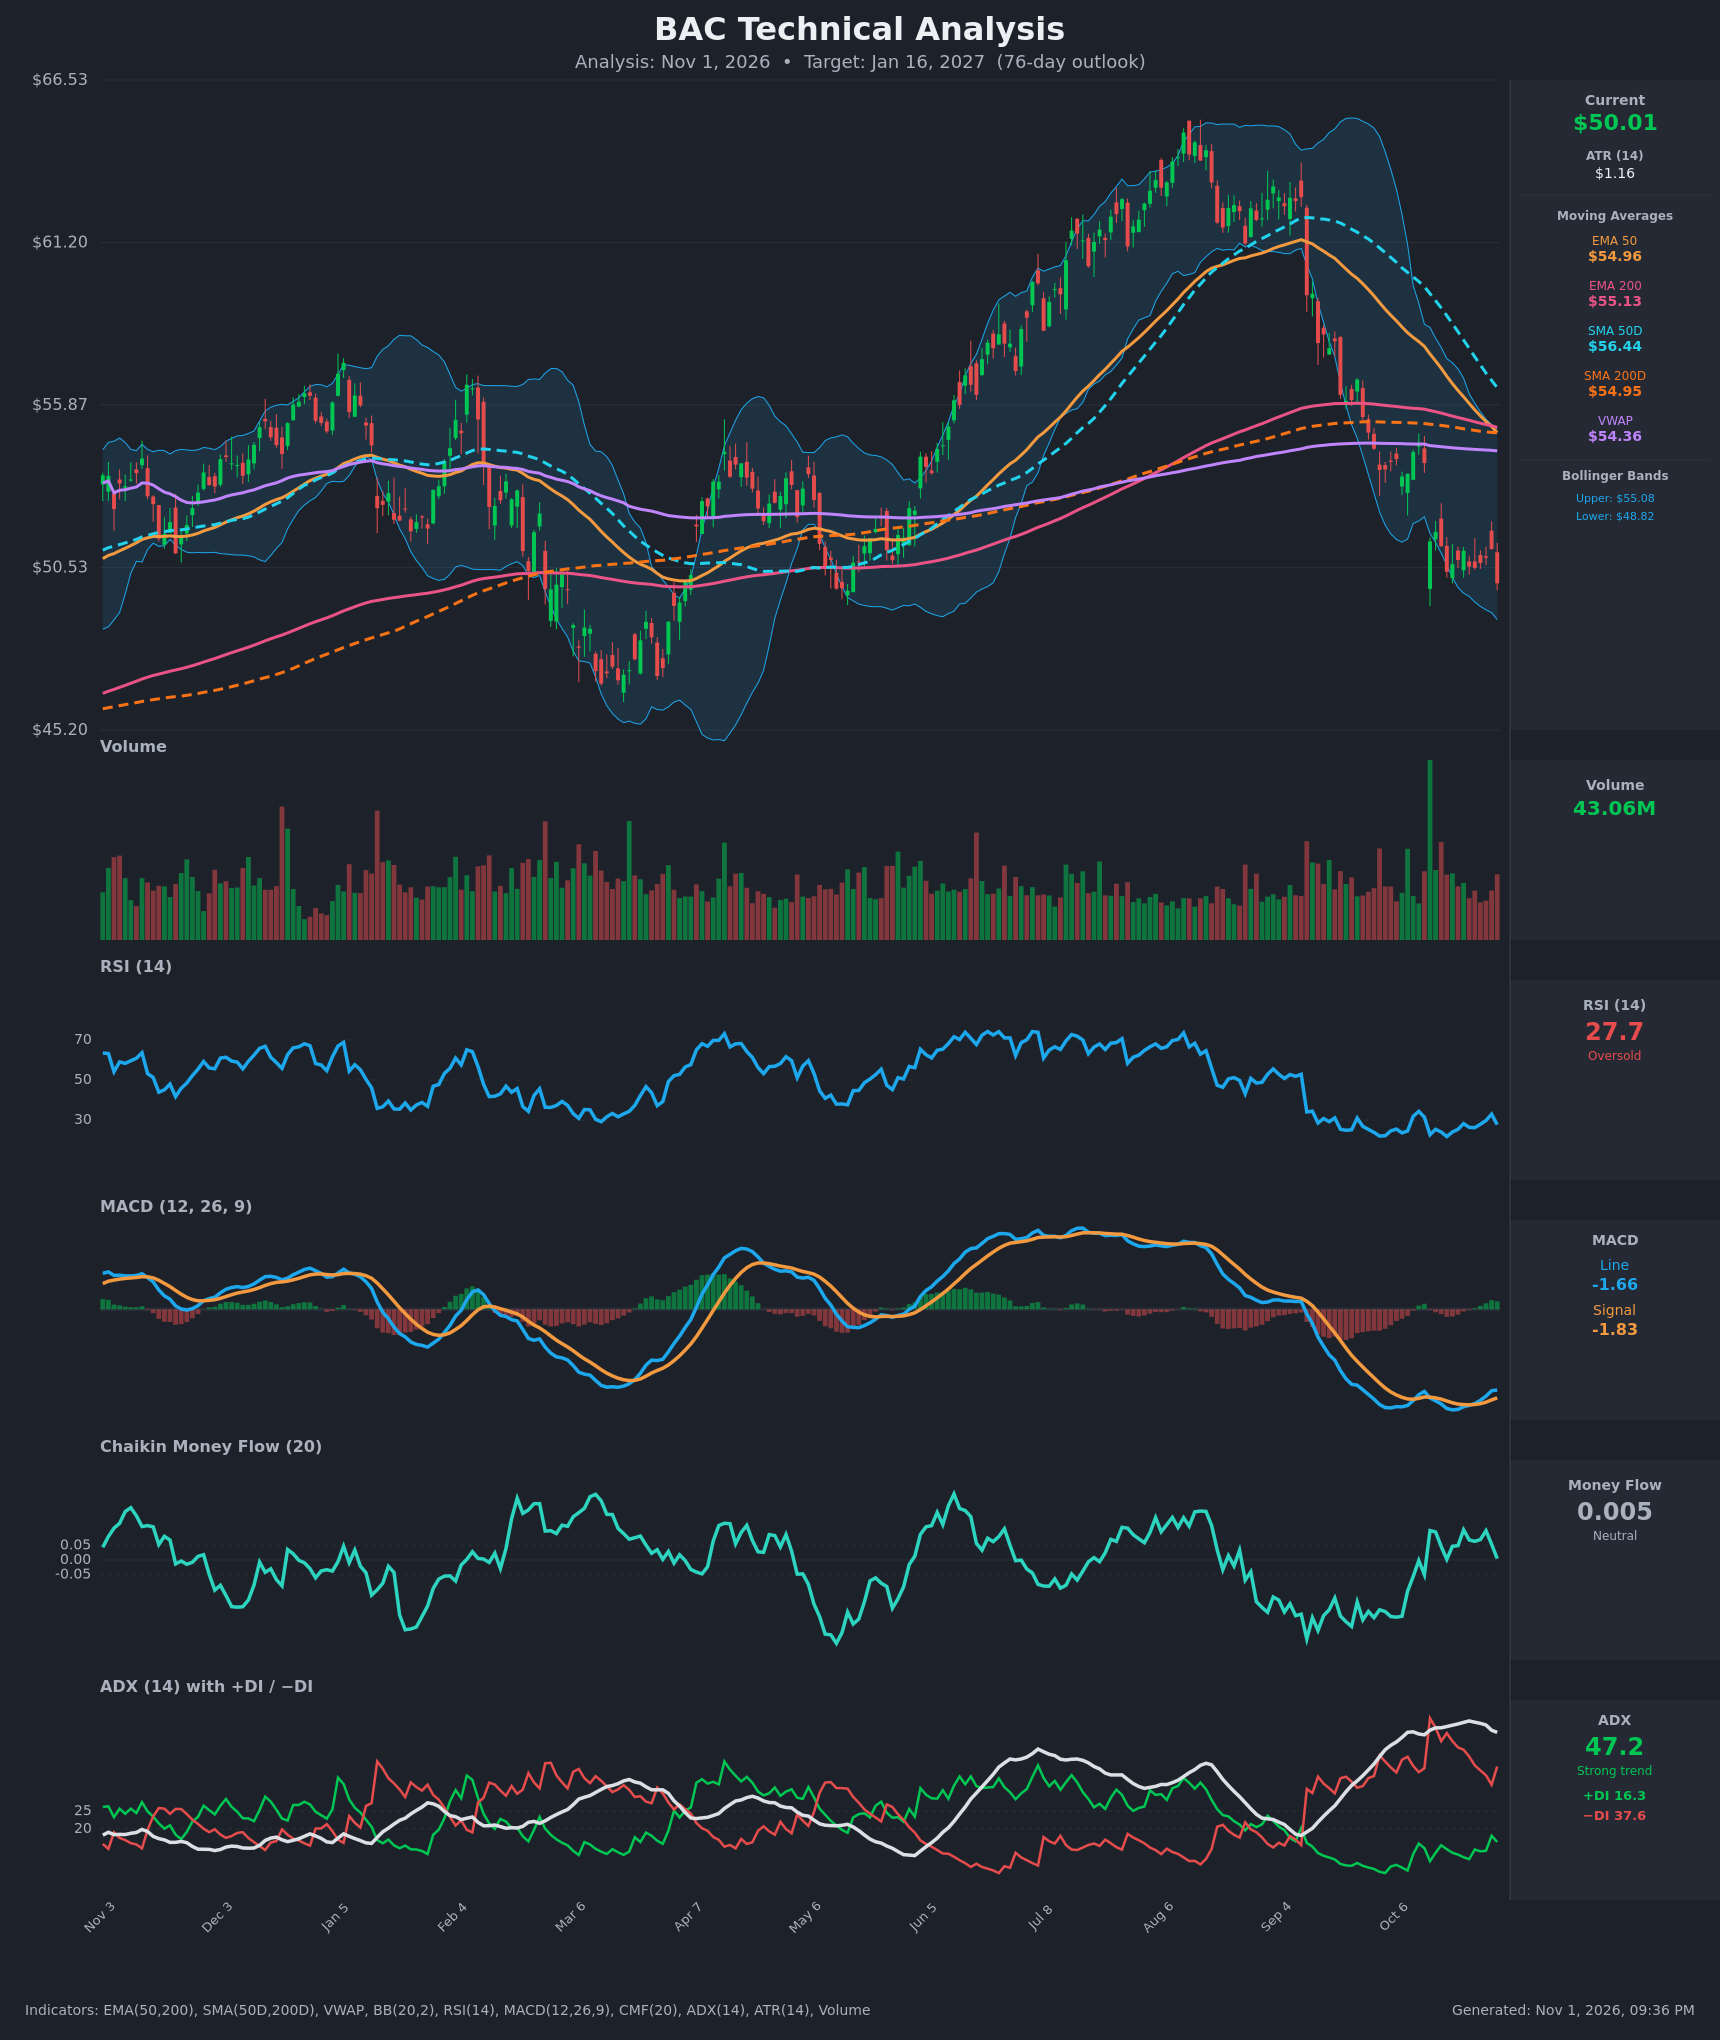
- RSI (14): 27.67, in oversold territory. It has stayed below 30 for most of the last 12 sessions. RSI made a low of 21.7 on Oct 19 at a price of $50.39, and today's price is lower at $50.01 with RSI at 27.7. That is a mild bullish momentum divergence, but RSI is still pinned low and has not turned up decisively. [Neutral]
- 20 EMA: The 20 EMA isn't supplied. The 20-period Bollinger midline is about $51.95 (midpoint of $55.08 and $48.82), and price is below it. The EMA50 at $54.96 and EMA200 at $55.13 are both falling or flat well overhead. Price is about 9% below the EMA50 and acts as a ceiling. [Bearish]
- MACD: Line -1.663 is above Signal -1.827, so the histogram is slightly positive (+0.16). The line crossed back above the signal around Oct 29–30 after rolling over from -2.07. Both lines are still deeply negative, so this is a tentative bullish crossover from a low base. [Bullish]
- Bollinger Bands (20): Upper $55.08, lower $48.82, midline about $51.95. Price at $50.01 sits in the lower third, about $1.19 above the lower band. The bands have narrowed from the wide September expansion, so volatility is compressing. The close is below the midline, consistent with a downtrend, but a sharp new leg down isn't confirmed. [Neutral]
- CMF (20): 0.005, inside the ±0.05 neutral zone. It was mildly positive (0.05–0.10) through most of the October consolidation and has faded to flat, so buying pressure is not strong. [Neutral]
- ADX (14): 47.2 with −DI 37.6 above +DI 16.3, a very strong established downtrend. ADX has been above 45 for more than two weeks and is flattening, and −DI is off its Oct 14 peak of 51.2. Such high ADX readings often mark trend exhaustion, but the trend is still bearish. [Strong Trend – Bearish]
- Volume: 43.06M on a red bar, above the recent average. The large spike in early Oct came on the breakdown, with no capitulation-style climax since. Selling is orderly rather than panicked. [Neutral to slightly Bearish]
DIVERGENCES & TRENDS
- Bullish divergence: MACD made a lower low of -2.07 on Oct 20 and has since risen to -1.66 while price retests the $50 area. RSI shows the same pattern against the Oct 19 low.
- Trend: Price is below EMA50, EMA200, SMA50D, SMA200D and VWAP ($54.36). The SMA50D at $56.44 is still above the SMA200D at $54.95 but falling fast, so a death cross is imminent in the coming weeks. The EMA50 crossed below the EMA200 on Oct 29 (54.96 vs 55.13), which is already a bearish EMA cross.
- DI trend: −DI has been declining from 51 to 37.6 while +DI is stuck around 11–18. Selling pressure is easing but bulls have not taken control.
- MACD: A bullish signal-line crossover below zero is a low-quality signal and needs follow-through.
- Price action: After the roughly 18% drop from the $61 area, price consolidated between about $50.4 and $51.7 for two weeks. The latest close of $50.01 slipped below that base.
CHART PATTERNS
- Bearish Flag / Pennant (continuation): The sharp decline followed by a tight sideways range fits this pattern. The latest close under $50.39 is a tentative breakdown. The measured move from the pole would target the low-to-mid $40s, though that is a stretched target given oversold conditions.
- Bullish Triple/Double Bottom (reversal, possible): Repeated tests of the $50.0–$50.5 zone (Oct 19, 23, 26 and today) form a potential base. A close above about $51.7 would confirm it, with a target near the $54–55 MA cluster.
- Neither pattern is confirmed. The nearby band of EMA50, EMA200, SMA200D and VWAP at $54–55 is a major resistance zone for any rebound.
- In the March low, a similar deep-oversold, high-ADX setup was followed by a multi-week rebound to the moving-average cluster.
POTENTIAL SCENARIOS
- Scenario 1: Bullish Oversold Mean-Reversion Bounce — RSI and MACD divergences and a base at $50 allow a rebound toward the falling EMA50/EMA200/VWAP cluster, with the rally stalling below the SMA50D. Trigger: close above $51.70 with MACD histogram expanding and RSI back above 40. Target: $53.00–$55.00. Invalidation: sustained close below $48.80 (lower Bollinger Band). (50% probability)
- Scenario 2: Bearish Trend Continuation / Flag Breakdown — The ADX 47 downtrend, −DI dominance and an imminent death cross drive price lower, with the breakdown below $50.39 extending the move. Trigger: daily close below $49.00 on rising volume. Target: $46.00–$47.00. Invalidation: close above $52.00. (35% probability)
- Scenario 3: Neutral Range Consolidation — Price chops between $48.50 and $53.00 as momentum resets. Trigger: ADX falling below 35 with RSI oscillating 35–50. Target: $50–$52. Invalidation: break of either range boundary. (15% probability)
PRICE TARGETS
For the 76-day horizon (Jan 16, 2027):
- Target Price: $53.20
- Expected Range: $46.60 to $57.00 (width $10.40, about 20.8% of the current price, in line with the 18–30% guidance for 61–180 days)
- Key Levels: Support at $48.80, Resistance at $55.00
OVERALL BIAS
OVERALL BIAS: BULLISH - The stock is deeply oversold (RSI under 30 for weeks), with bullish MACD and RSI divergences, a flattening ADX, a fading −DI and a repeatedly defended $50 base. These point to a rebound over 76 days toward the $53–55 moving-average cluster. Conviction is modest: the trend is still firmly down, price is below every moving average, and a breakdown under $48.80 would invalidate the call.
This is educational analysis and not financial advice.