BB 76-day bearish forecast — Nov 1, 2026
- Bias: Bearish
- Timeframe: 76 days (made Nov 1, 2026, target date Jan 15, 2027)
- Price at analysis: $8.42
- Price target: $7.95
- Expected range: $7.00 – $9.30
- Result: Pending — graded after the close on Jan 15, 2027
Get a free AI analysis of BB today
Analysis
TECHNICAL INDICATORS
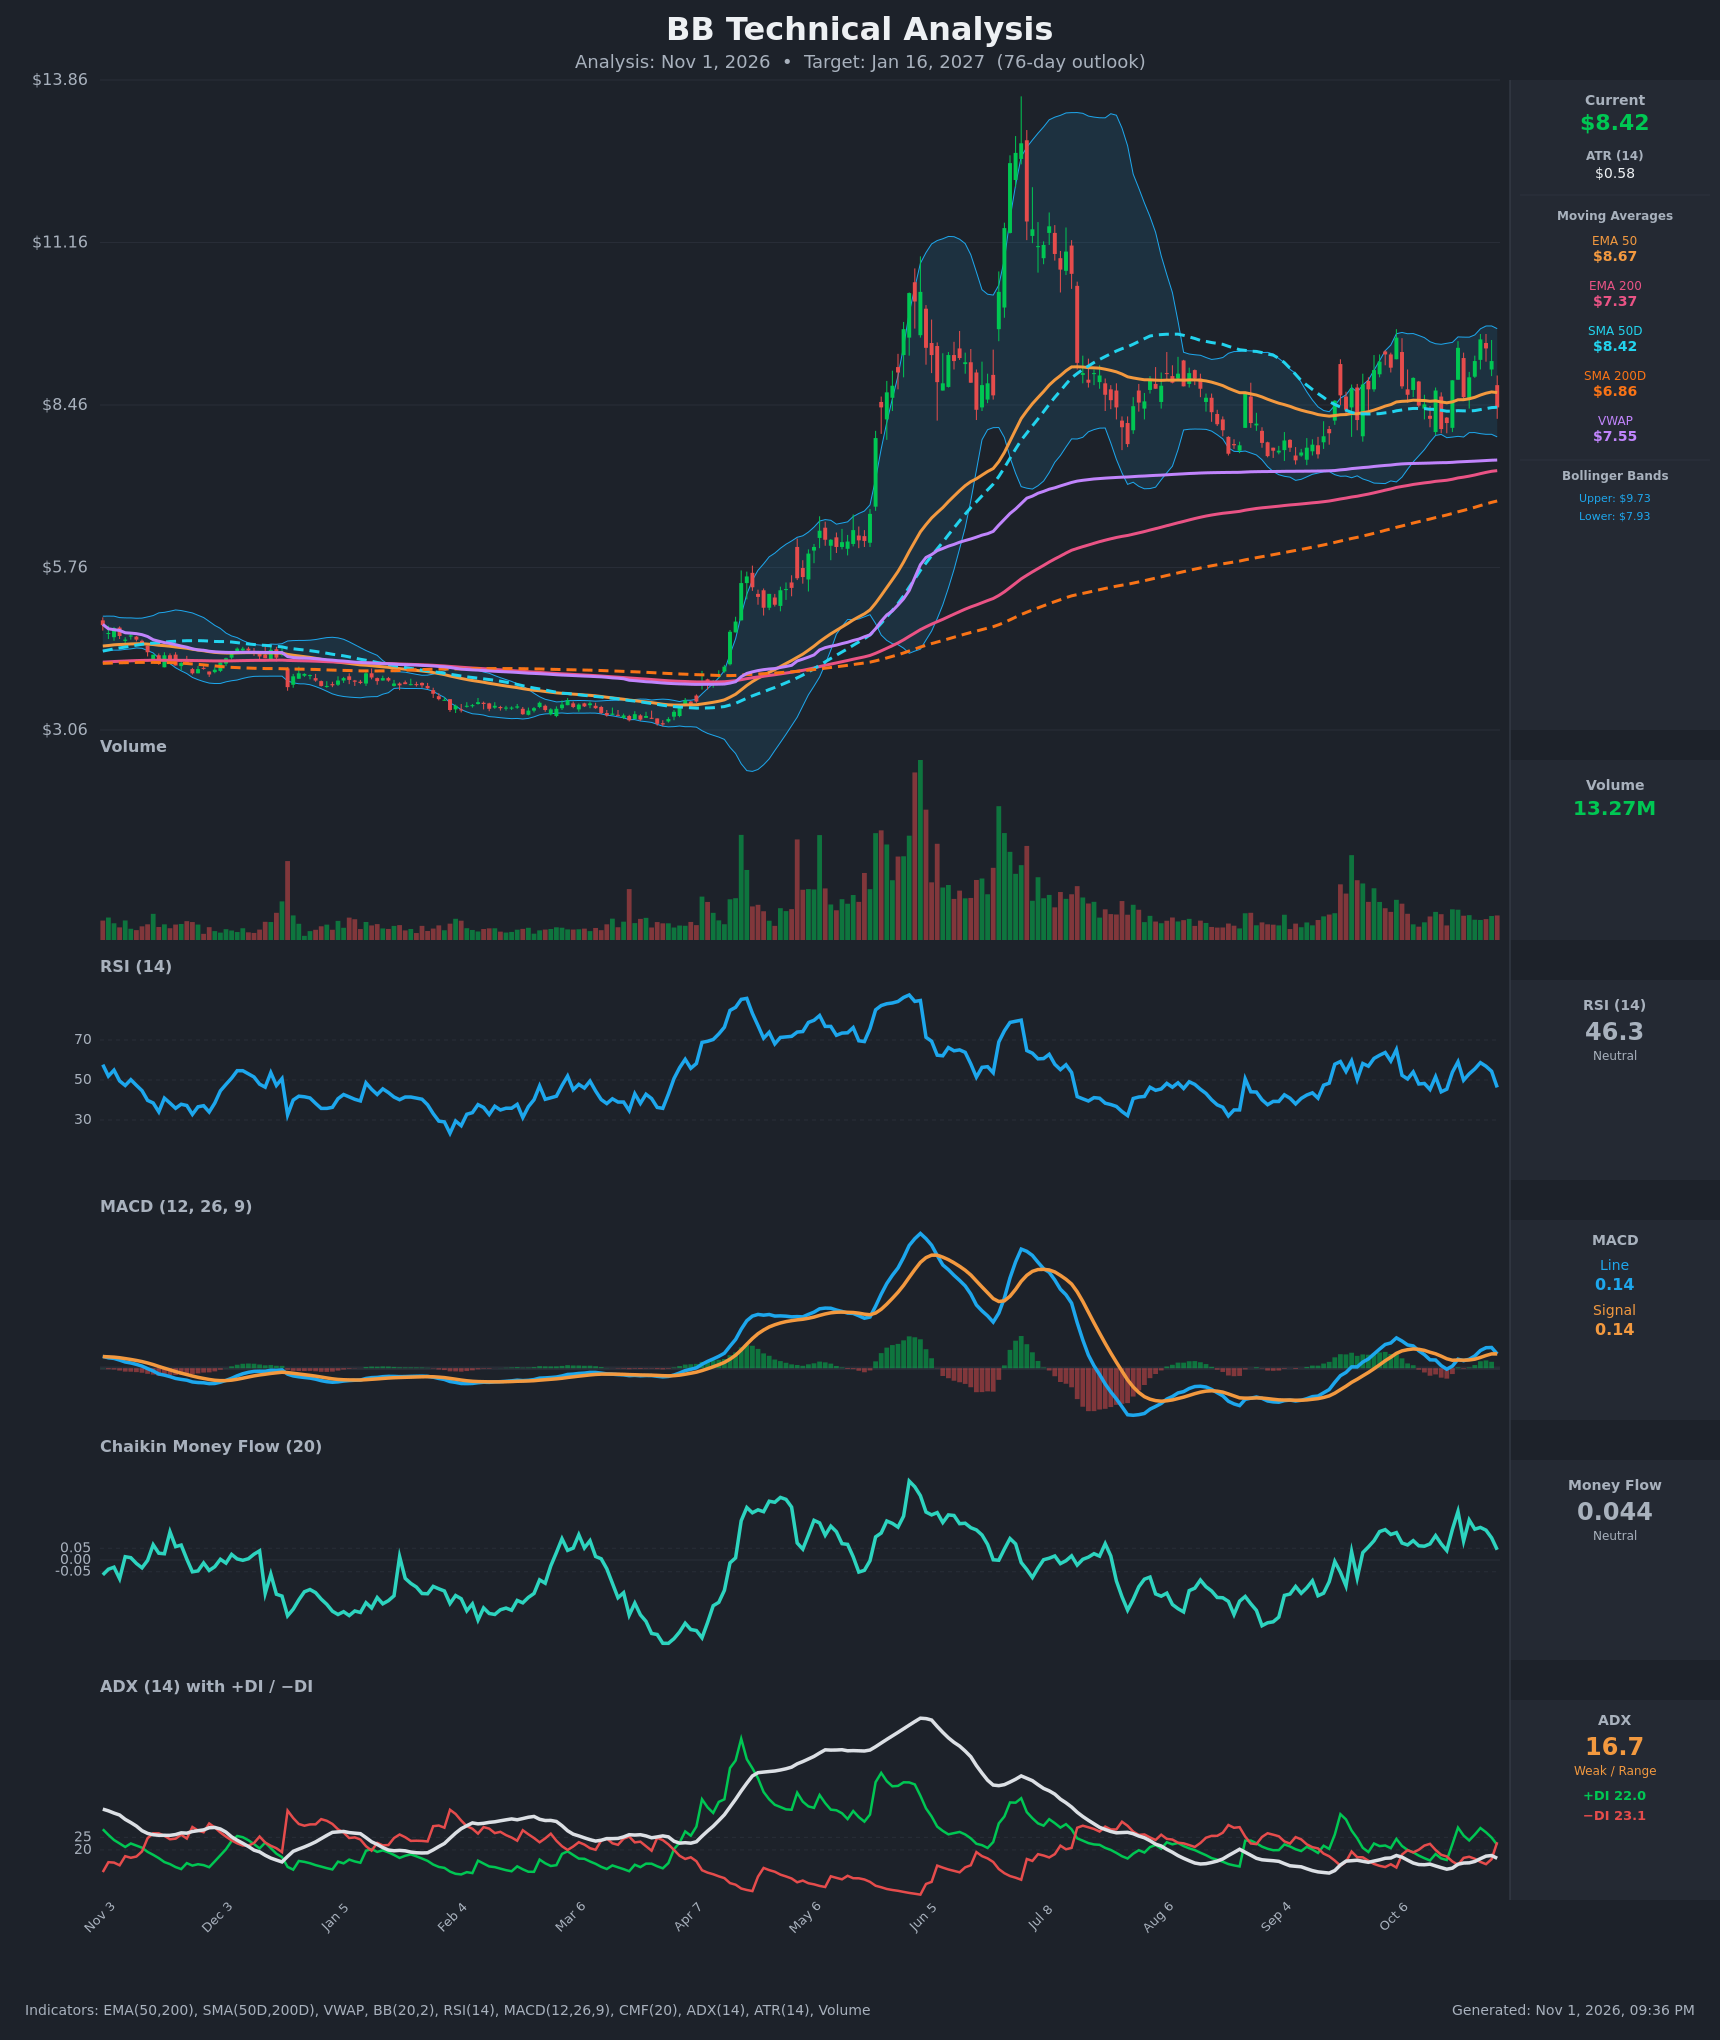
- RSI (14): 46.29, down sharply from 58.7 on Oct 27 and now below the 50 midline. It is neither oversold nor overbought, but momentum is rolling over. [Bearish]
- 20 EMA: The 20 EMA is not supplied. The 50 EMA is $8.67 and price ($8.42) closed below it, so it now acts as overhead resistance. The 50 EMA is also above the 200 EMA ($7.37), which keeps the intermediate trend positive. [Bearish]
- MACD: Line 0.1369 vs signal 0.1373. The line just crossed below the signal from 0.199 vs 0.137, and the histogram is flat to slightly negative. All values sit close to zero, so there is no strong trend impulse. [Bearish]
- Bollinger Bands (20): Upper $9.73, lower $7.93, midline about $8.83. Price reversed from near the upper band ($9.55 close on Oct 27) and now sits below the midline, with room to fall toward the lower band. Band width is moderate. [Bearish]
- CMF (20): 0.044, falling from 0.207 on Oct 21 and now just under the +0.05 accumulation threshold. Buying pressure is fading but not yet distribution. [Neutral]
- ADX (14): 16.7 with −DI (23.1) above +DI (22.0). A fresh bearish DI crossover occurred on Oct 30, but ADX below 20 means there is no real trend. [Weak Trend, slight bearish tilt]
- Volume: 13.27M on a −8.4% down day, which is above the quiet baseline of recent weeks. The drop came on above-average volume, a mild sign of distribution after the rally to $9.55. [Mildly Bearish]
DIVERGENCES & TRENDS
- Moving averages: SMA50D ($8.42) has been flat for weeks and price is sitting exactly on it. A golden cross is already in place (SMA50D $8.42 vs SMA200D $6.86), and price is above the SMA200D and VWAP ($7.55), so the long-term trend is still up. No death cross is near.
- Bearish crossovers: MACD crossed below its signal and −DI crossed above +DI on the same bar. RSI broke below 50 (54.4 → 46.3).
- Divergence: Price made a higher high on Oct 27 ($9.55) while RSI (58.7) and ADX stayed modest, so the rally was not backed by strong momentum. The June peak near $13 had far stronger momentum, and momentum has not rebuilt since.
- Reversal bar: The Oct 30 close of $8.42 gave back almost all of the Oct 20–27 advance in three sessions.
- Positives: The 200-day averages are still rising, and the CMF stayed positive for the whole October bounce.
CHART PATTERNS
- Bearish Double Top (reference diagram, small scale): The highs at $9.41 (Oct 21) and $9.55 (Oct 27) form two peaks. The neckline is around $8.2–$8.6, and price is now testing it. A break below $8.06–$8.20 gives a measured move of roughly $9.5 − $1.3 ≈ $7.90–$8.00, which lines up with the lower Bollinger Band ($7.93).
- Broader consolidation: Since the July–August decline, price has ranged between about $7.3 and $9.6. ADX below 20 confirms this sideways structure. A higher low near $7.3–$7.4 (September/October) keeps an ascending-triangle-style bullish alternative alive if $9.55 is cleared.
- Larger structure: The collapse from the June ~$13 spike has stabilised above rising 200-day averages. This is a post-spike base, not a confirmed reversal either way.
POTENTIAL SCENARIOS
- Scenario 1: Bearish Double-Top Breakdown — Price loses the neckline and the 50-day area, then drifts to the lower band and mean-reverts toward range support and VWAP. Trigger: daily close below $8.06 with MACD/DI staying bearish. Target: $7.90–$7.95, extending to $7.40–$7.55 (VWAP/EMA200 zone). Invalidation: close back above $8.95 (above the 50 EMA and the midline). (45% probability)
- Scenario 2: Neutral Range Chop — Price oscillates between $7.60 and $9.20 while ADX stays below 20, ending near the current level. Trigger: failure to close decisively below $8.06 or above $9.20. Target: $8.30–$8.80. Invalidation: a close below $7.55 or above $9.60. (25% probability)
- Scenario 3: Bullish Range Breakout — Buyers defend the $8.0–$8.2 area, CMF turns back above +0.05, and the higher-low structure leads to a breakout above $9.55. Trigger: close above $9.55 on rising volume. Target: $10.40–$11.00. Invalidation: close below $7.90. (30% probability)
PRICE TARGETS
- Target Price: $7.95 (76-day horizon)
- Expected Range: $7.00 to $9.30. Width is $2.30, or about 27% of the current price, which fits the 61–180 day guidance of 18–30%.
- Key Levels: Support at $7.55 (VWAP, then the $7.37 EMA 200). Resistance at $8.67 (EMA 50), with major resistance at $9.55.
OVERALL BIAS
OVERALL BIAS: BEARISH - A bearish MACD crossover, a −DI crossover, RSI below 50, and a rejection at the upper band forming a small double top on above-average volume point to a retest of the $7.9 lower band. The still-rising 200-day averages should limit the downside, which is why the target is modest.
This is educational analysis and not financial advice.