KWEB 76-day bullish forecast — Nov 1, 2026
- Bias: Bullish
- Timeframe: 76 days (made Nov 1, 2026, target date Jan 15, 2027)
- Price at analysis: $22.74
- Price target: $24.30
- Expected range: $20.60 – $25.80
- Result: Pending — graded after the close on Jan 15, 2027
Get a free AI analysis of KWEB today
Analysis
TECHNICAL INDICATORS
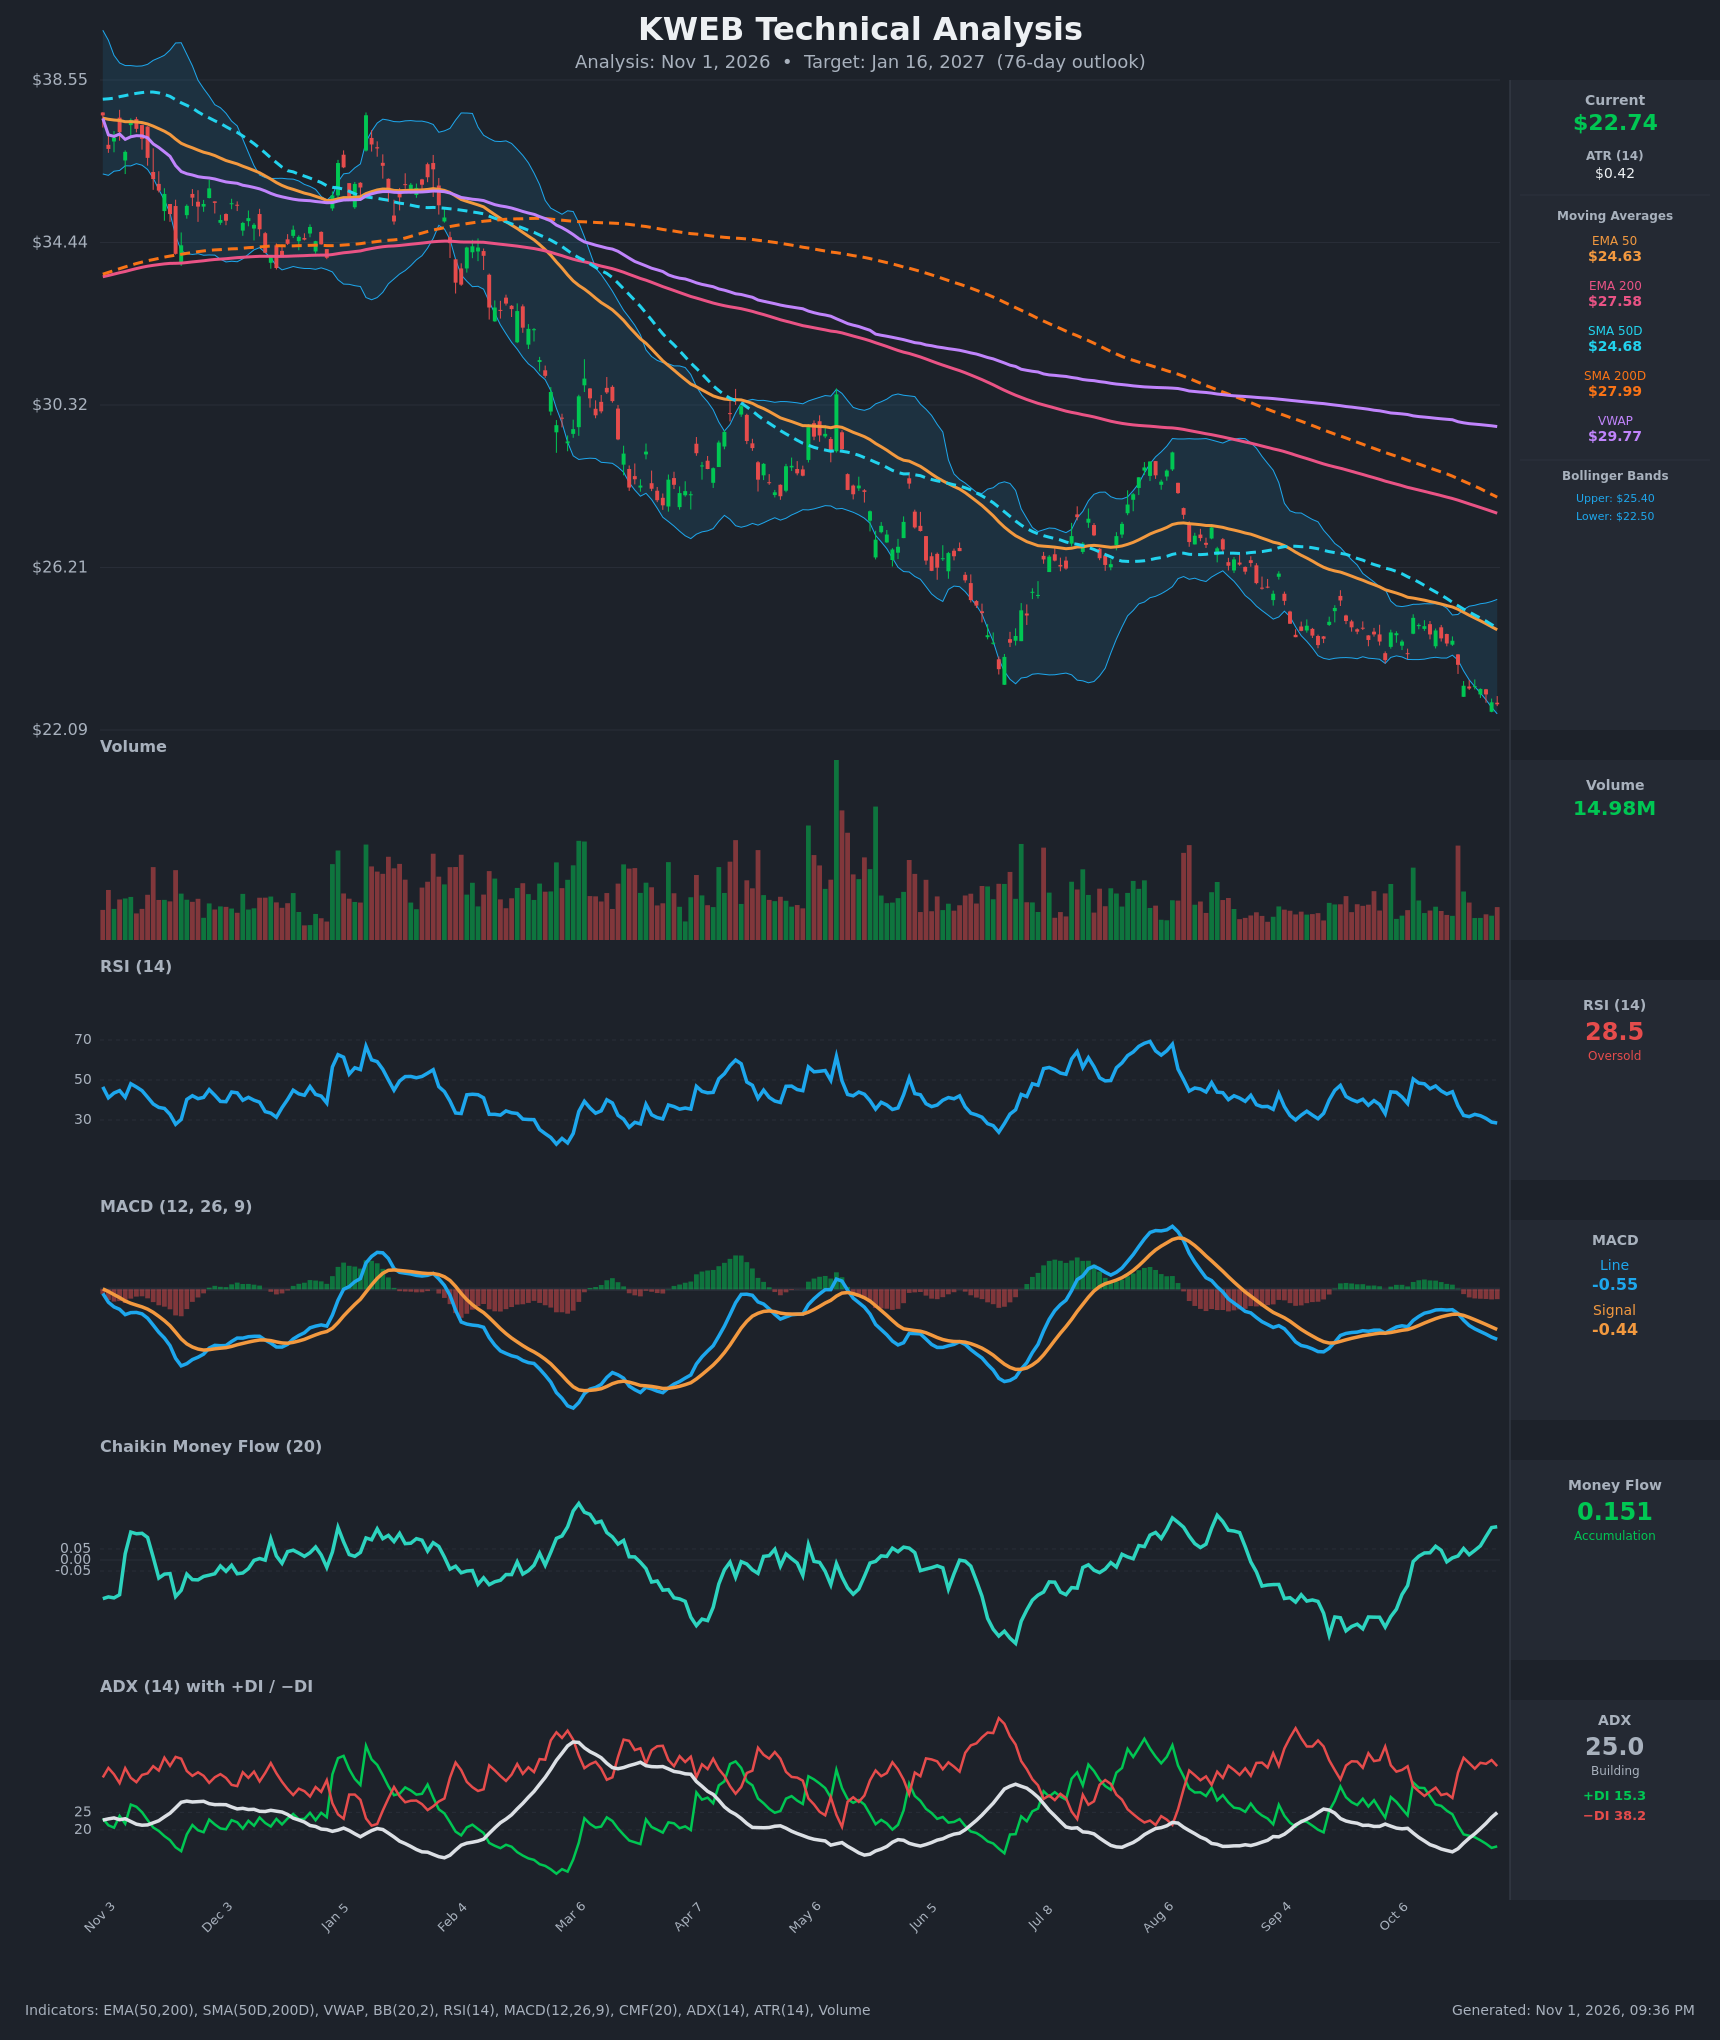
- RSI (14): 28.48, oversold and at its lowest level since the early-June trough. It has fallen from about 50 in mid-October. The June low in price was higher than the current price, while RSI is not meaningfully lower than it was then. That hints at fading downside momentum. [Bullish]
- 20 EMA: The 20 EMA is not supplied. The nearest proxy, the 50 EMA, is $24.63, about 8% above price and sloping down. Price has been below it since early October, so it acts as resistance. [Bearish]
- MACD: The line (-0.55) is below the signal (-0.44) after a bearish crossover around Oct 21-22. The histogram is negative and widening, so downside momentum is still building. [Bearish]
- Bollinger Bands (20): Price at $22.74 is hugging the lower band ($22.50), with the upper band at $25.40. Price is in a "band walk" down. The band width is modest, so this is a trend move rather than a volatility blowout. Walking the lower band can persist, but it also marks stretched conditions. [Neutral]
- CMF (20): 0.151, well above +0.05 and rising since early October while price made new lows. That is a clear divergence, with buying pressure showing up on weakness. [Accumulation]
- ADX (14): 25.0 and rising from 13.7 on Oct 20. −DI (38.2) is far above +DI (15.3), so the bears are firmly in control and the downtrend is now at "strong trend" strength. [Strong Trend – Bearish]
- Volume: 14.98M, in line with or slightly below recent averages, with no capitulation spike. Volume has been muted during the October slide, which signals steady selling without panic. [Neutral / Mildly Bearish]
DIVERGENCES & TRENDS
- Bullish divergence (CMF): CMF has climbed from about -0.05 to +0.15 over the past month while price made lower lows. This is the most notable positive signal on the chart.
- Possible bullish RSI divergence: Price is below the June low (~$23), but RSI at 28.5 is higher than its June, March and earlier lows. It is not yet a clean divergence.
- Moving average structure: Price is below the EMA50 ($24.63), SMA50D ($24.68), EMA200 ($27.58), SMA200D ($27.99) and VWAP ($29.77). The 50-day averages sit below the 200-day averages, so the death cross is already in place. The 200-day averages are still falling.
- Trend: The chart shows a roughly one-year sequence of lower highs and lower lows, from about $38 down to $22.7. Rallies have faded at the falling 50-day averages.
- MACD: The bearish crossover in late October is still intact, with the histogram turning more negative.
- ADX/DI: −DI has stayed above +DI since Oct 21. ADX is rising, so trend strength is increasing.
- Mean-reversion precedent: Prior RSI readings near 25-30 (March, early June) were followed by sharp 15-25% rebounds in the following weeks.
CHART PATTERNS
- Long-term descending channel / bearish continuation: The year-long sequence of lower highs and lows resembles a bearish rising-wedge or flag continuation on a larger scale. Each bounce has failed at the falling 50-period averages.
- Possible Bullish Falling Wedge (reversal): The recent decline from about $26.5 (Aug-Sept) to $22.7 is narrowing along the lower Bollinger band, with fading RSI and CMF divergence. The breakout level would be the $24.60 area (EMA50/SMA50D). This is not confirmed yet.
- Breakdown risk: Price has broken below the June low (~$23). Without a reclaim, that level becomes resistance, and a measured-move extension lower is possible.
- Targets: A wedge breakout would aim for the prior consolidation near $25.5-$26.5. A failed bounce would project toward $20.5-$21.
POTENTIAL SCENARIOS
- Scenario 1: Bullish Oversold Rebound / Divergence Resolution — Positive CMF and an oversold RSI let price stabilize and mean-revert toward the falling 50-day averages. This repeats prior bounces from RSI around 25-30. Trigger: close back above the June low area (~$23.20), then above $24.00 on a MACD histogram turn. Target: $24.30-$25.40 (upper Bollinger band). Invalidation: sustained close below $21.80. (45% probability)
- Scenario 2: Bearish Trend Continuation — −DI dominance, ADX rising, and the MACD sell signal keep price walking down the lower band after the June-low breakdown. Trigger: failure at $23.20-$23.50 followed by a break below $22.00. Target: $20.50-$21.00. Invalidation: close above $24.70 (EMA50/SMA50D). (40% probability)
- Scenario 3: Neutral Base Building — Price chops between roughly $21.80 and $24.60 as selling exhausts without a clear upside catalyst. Trigger: ADX rolls over below 20 with price pinned mid-range. Target: $22.50-$23.50. Invalidation: close beyond either range extreme. (15% probability)
PRICE TARGETS
- Target Price: $24.30 (76-day, Jan 16, 2027)
- Expected Range: $20.60 to $25.80. The width is $5.20, about 22.9% of the current price, which fits the 61-180 day guidance of 18-30%.
- Key Levels: Support at $22.00, Resistance at $24.65
OVERALL BIAS
OVERALL BIAS: BULLISH - Rising CMF (0.151) against new price lows, an oversold RSI (28.5) and price at the lower Bollinger band favor a mean-reversion bounce toward the falling 50-day averages over a 76-day horizon. Conviction is modest, because the trend is strongly bearish (−DI 38 vs +DI 15, ADX rising, bearish MACD, price below every moving average), and a failure to reclaim ~$23.20 would favor the bearish scenario.
This is educational analysis and not financial advice.