IWM 76-day bullish forecast — Nov 1, 2026
- Bias: Bullish
- Timeframe: 76 days (made Nov 1, 2026, target date Jan 15, 2027)
- Price at analysis: $279.33
- Price target: $291.00
- Expected range: $258.00 – $318.00
- Result: Pending — graded after the close on Jan 15, 2027
Get a free AI analysis of IWM today
Analysis
TECHNICAL INDICATORS
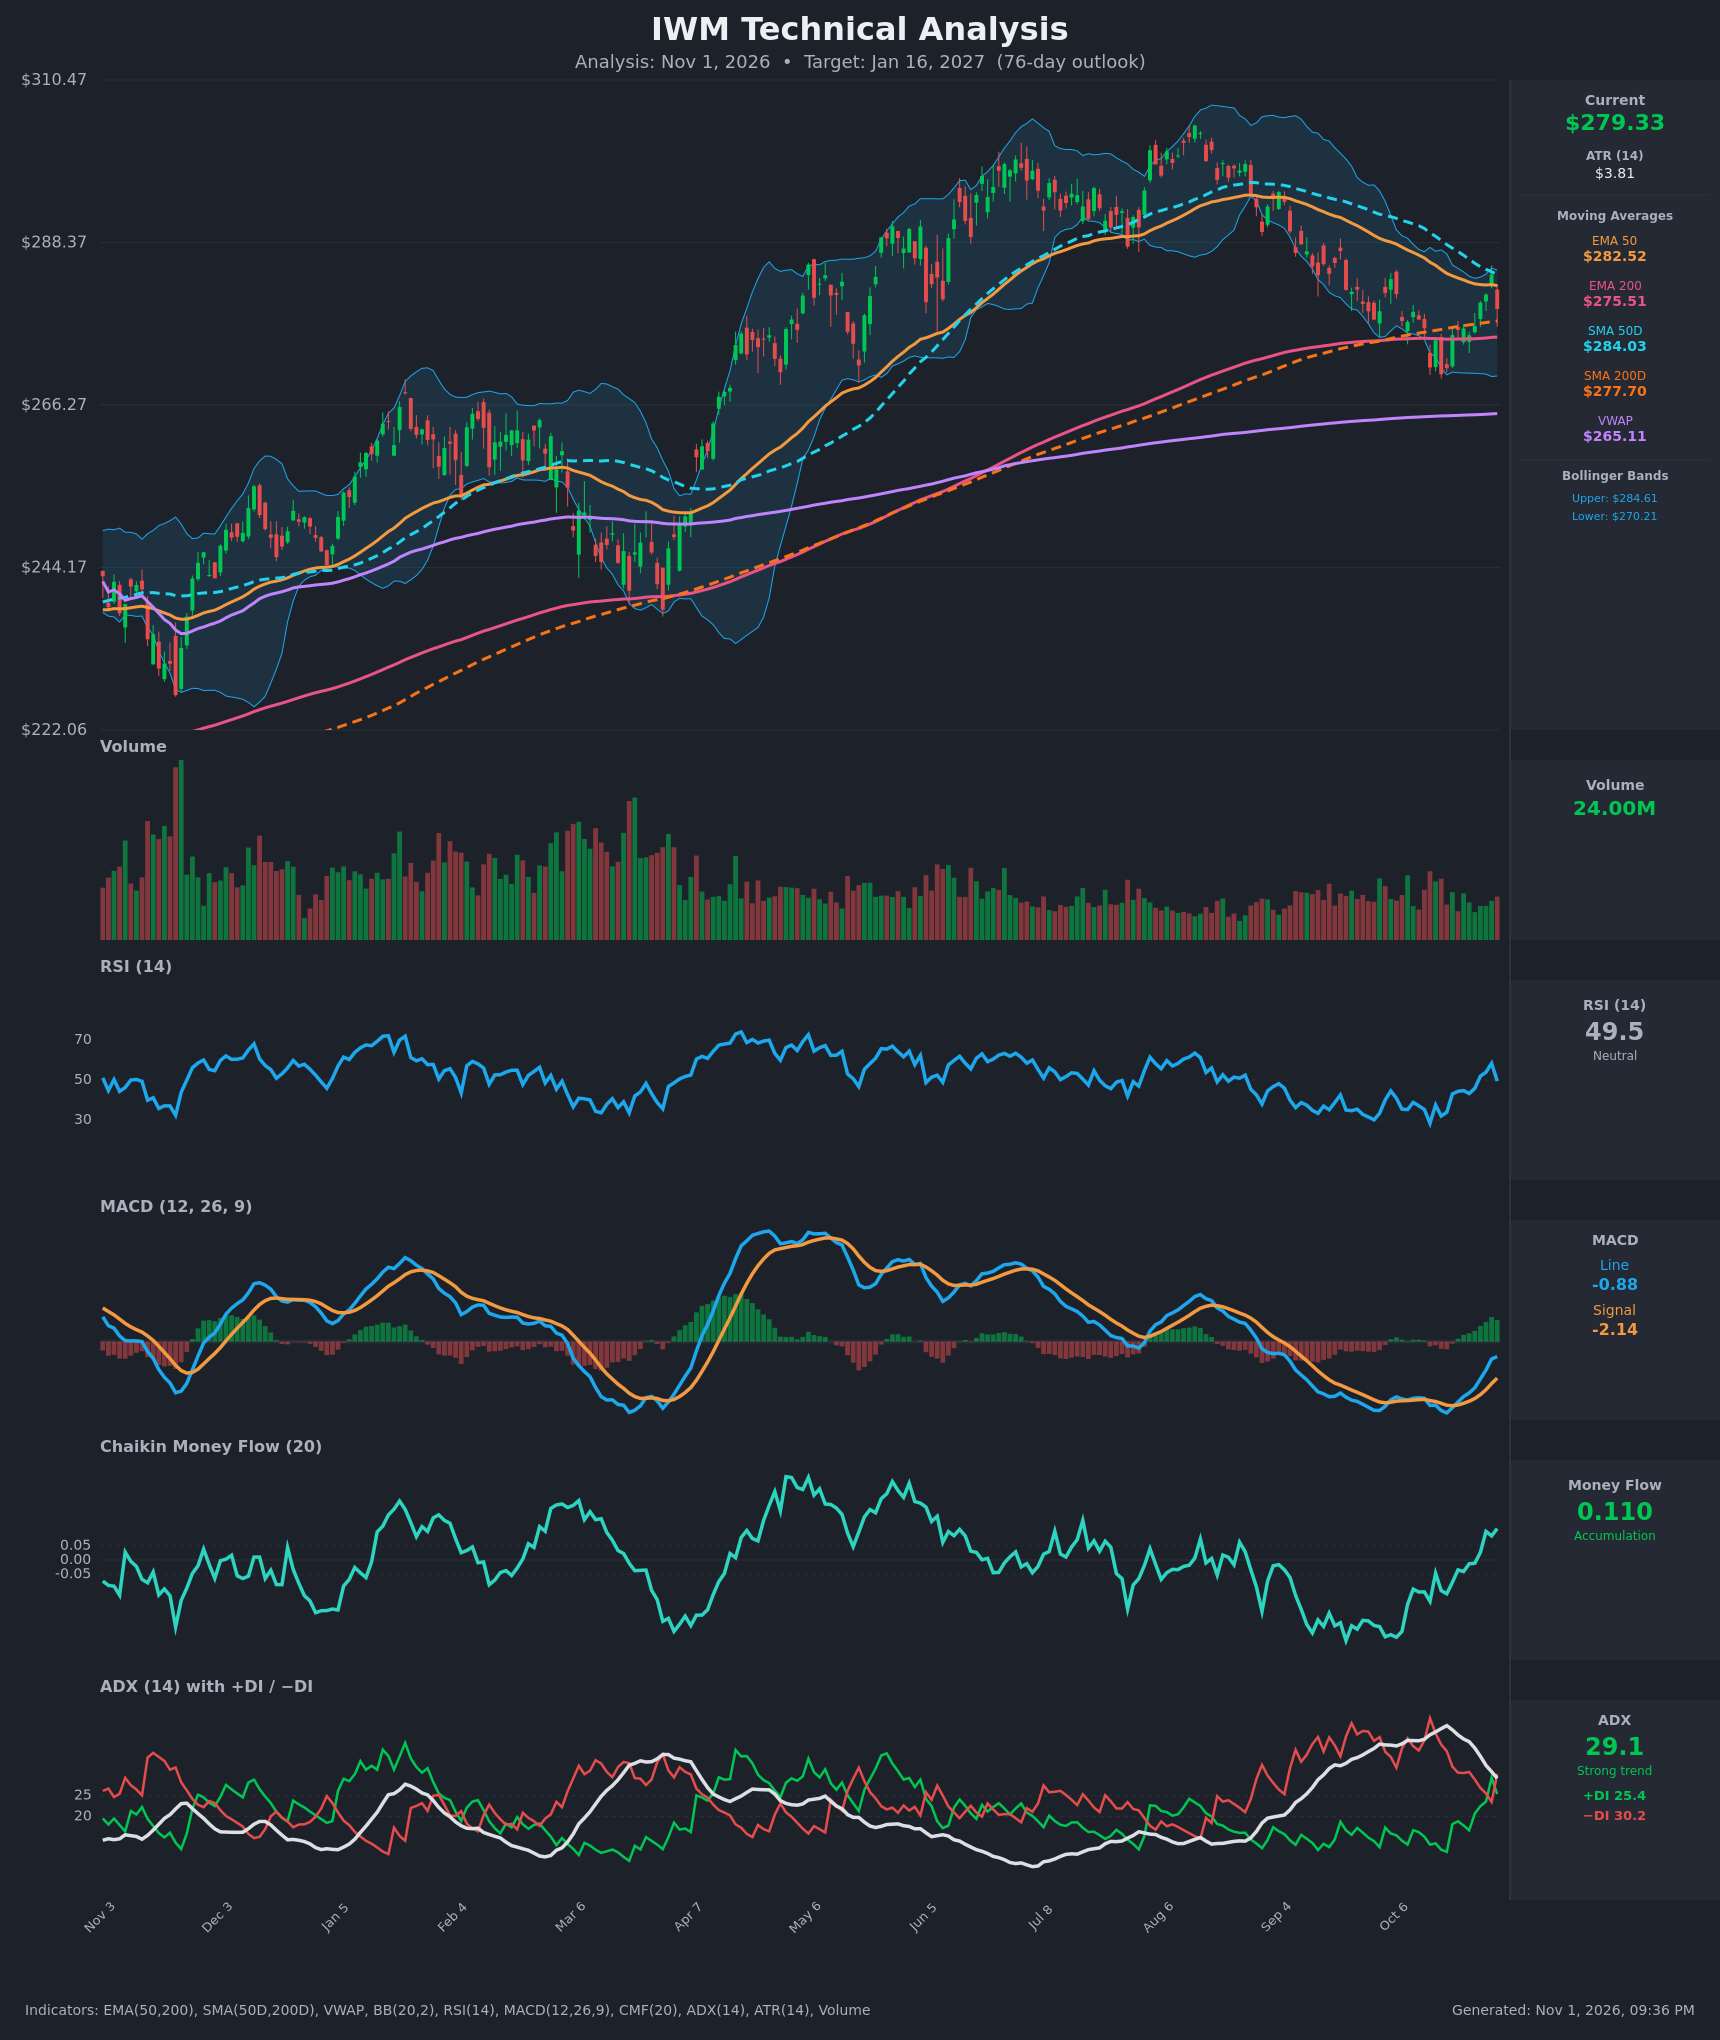
- RSI (14): 49.5, right at the midline. It fell from 58.4 on Oct 29 after a rebound from the 28-37 oversold zone in mid-October. The recovery is intact, but the latest pullback shows momentum stalling. [Neutral]
- 20 EMA: Not supplied. Using the EMA 50 ($282.52) as the nearest proxy, price is about 1.1% below it, so it acts as overhead resistance. The EMA 50 is still declining. Price sits above the EMA 200 ($275.51), which is nearby support. [Neutral]
- MACD: Line -0.875 is above Signal -2.139, a bullish crossover that occurred around Oct 20-27. The histogram is positive (+1.26) and has been rising for about 10 bars. Both lines are still below zero, so this is a recovery from a bearish phase rather than a confirmed new uptrend. [Bullish]
- Bollinger Bands (20): Upper $284.61, lower $270.21, with price at $279.33 just above the midline (about $277.4). Price bounced off the lower band in mid-October and was rejected near the upper band at $284 on Oct 29. The bands are moderately narrow, so this is a range within a pullback. [Neutral]
- CMF (20): 0.110, above +0.05 and up from -0.145 on Oct 14. It has been positive since Oct 27 and is the highest reading in several weeks. This points to accumulation on the bounce. [Accumulation]
- ADX (14): 29.1 and falling from a 41.7 peak, so the prior downtrend is losing strength. −DI (30.2) is back above +DI (25.4) after a one-day bullish +DI lead on Oct 29. Bears still hold a slight edge, but the trend is fading. [Strong but weakening trend, bearish lean]
- Volume: 24.00M, which is average to below average compared with the past year. There was no volume surge on the October bounce and none on the Oct 30 pullback. There is no strong conviction from either side. [Neutral]
Other moving averages and levels:
- Price is above the SMA 200 ($277.70) and EMA 200 ($275.51), a long-term uptrend.
- The SMA 50 ($284.03) is above the SMA 200, so there is no death cross, and the golden-cross structure remains.
- The EMA 50 ($282.52) is above the EMA 200 but converging.
- Price is well above VWAP ($265.11).
DIVERGENCES & TRENDS
- Bullish momentum divergence: Price made a marginal lower low around Oct 16-19 (about $270), while RSI (32-34) and MACD (-4.17) made no equivalent deeper lows compared with earlier in the pullback. MACD then crossed up and its histogram turned positive.
- CMF: It improved from -0.145 to +0.110 while price was still at the lows, so money flow led price higher.
- ADX/DI: ADX has rolled over from 41.7 to 29.1 as the prior selloff exhausted. The DI lines are converging and could cross again. A +DI cross back above −DI would confirm the bullish turn.
- Rejection: The Oct 30 drop of about -1.6% from $284.01 came right at the SMA 50 and upper Bollinger Band, with RSI falling from 58 to 49.5. This is a short-term bearish signal and a reminder that the declining 50-day averages are resistance.
- Long-term trend: The peak near $305 in August was followed by a roughly 11% correction that held at the 200-day averages, which is a classic retest of long-term support.
CHART PATTERNS
- Bullish Double Bottom (small scale): The Oct 14-16 lows of $270-271 form two touches around a neckline near $276-277, and price has broken above that neckline. The measured move (about $6-7 above the neckline) gives $283-284, which matches the SMA 50 and upper Bollinger Band resistance cluster.
- Larger structure: The decline from the August high resembles a corrective pullback, with the 200 EMA/SMA acting as support. A close above $285 would reopen the path toward the $295-305 prior highs.
- No confirmed bearish reversal pattern such as a Head and Shoulders or Triple Top is present. The risk is a failed bounce and a retest of $270.
POTENTIAL SCENARIOS
- Scenario 1: Bullish Recovery Toward Prior Highs — The double-bottom bounce off the 200-day averages continues, the MACD recovery extends above zero, and price clears the SMA 50/upper-band cluster. Trigger: daily close above $285 on improving volume, with +DI crossing back above −DI. Target: $291 by mid-January, with a stretch toward $298-305. Invalidation: daily close below $270 (the October low and lower Bollinger Band). (50% probability)
- Scenario 2: Bearish Failed Bounce and Breakdown — Resistance at $284 holds, the −DI lead persists, and price loses the 200-day averages. Trigger: close below $275 (EMA 200/SMA 200). Target: $262-266, with an extension to the $255-258 zone. Invalidation: close above $286. (30% probability)
- Scenario 3: Neutral Range Consolidation — Price chops between the 200-day averages and the 50-day averages while ADX falls below 20. Trigger: repeated failures at $284 and holds at $272-275. Target: $275-285. Invalidation: close outside $268-287. (20% probability)
PRICE TARGETS
- Target Price: $291.00 (76-day, by about Jan 16, 2027)
- Expected Range: $258.00 to $318.00 (width $60 ≈ 21.5% of current price, consistent with the 61-180 day guidance of 18-30%)
- Key Levels: Support at $275.51 (EMA 200; deeper support at $270.21 and the October low), Resistance at $284.61 (upper Bollinger Band, SMA 50 at $284.03)
OVERALL BIAS
OVERALL BIAS: BULLISH - Price is holding above the rising 200-day averages after a double-bottom bounce, MACD has crossed up with a rising histogram, and CMF shows accumulation, while a fading ADX suggests the selloff is exhausted. Conviction is modest because the Oct 30 rejection at the 50-day averages and the −DI lead show bears are not yet done.
This is educational analysis and not financial advice.