QCOM 76-day bearish forecast — Nov 1, 2026
- Bias: Bearish
- Timeframe: 76 days (made Nov 1, 2026, target date Jan 15, 2027)
- Price at analysis: $164.79
- Price target: $159.00
- Expected range: $144.00 – $177.00
- Result: Pending — graded after the close on Jan 15, 2027
Get a free AI analysis of QCOM today
Analysis
TECHNICAL INDICATORS
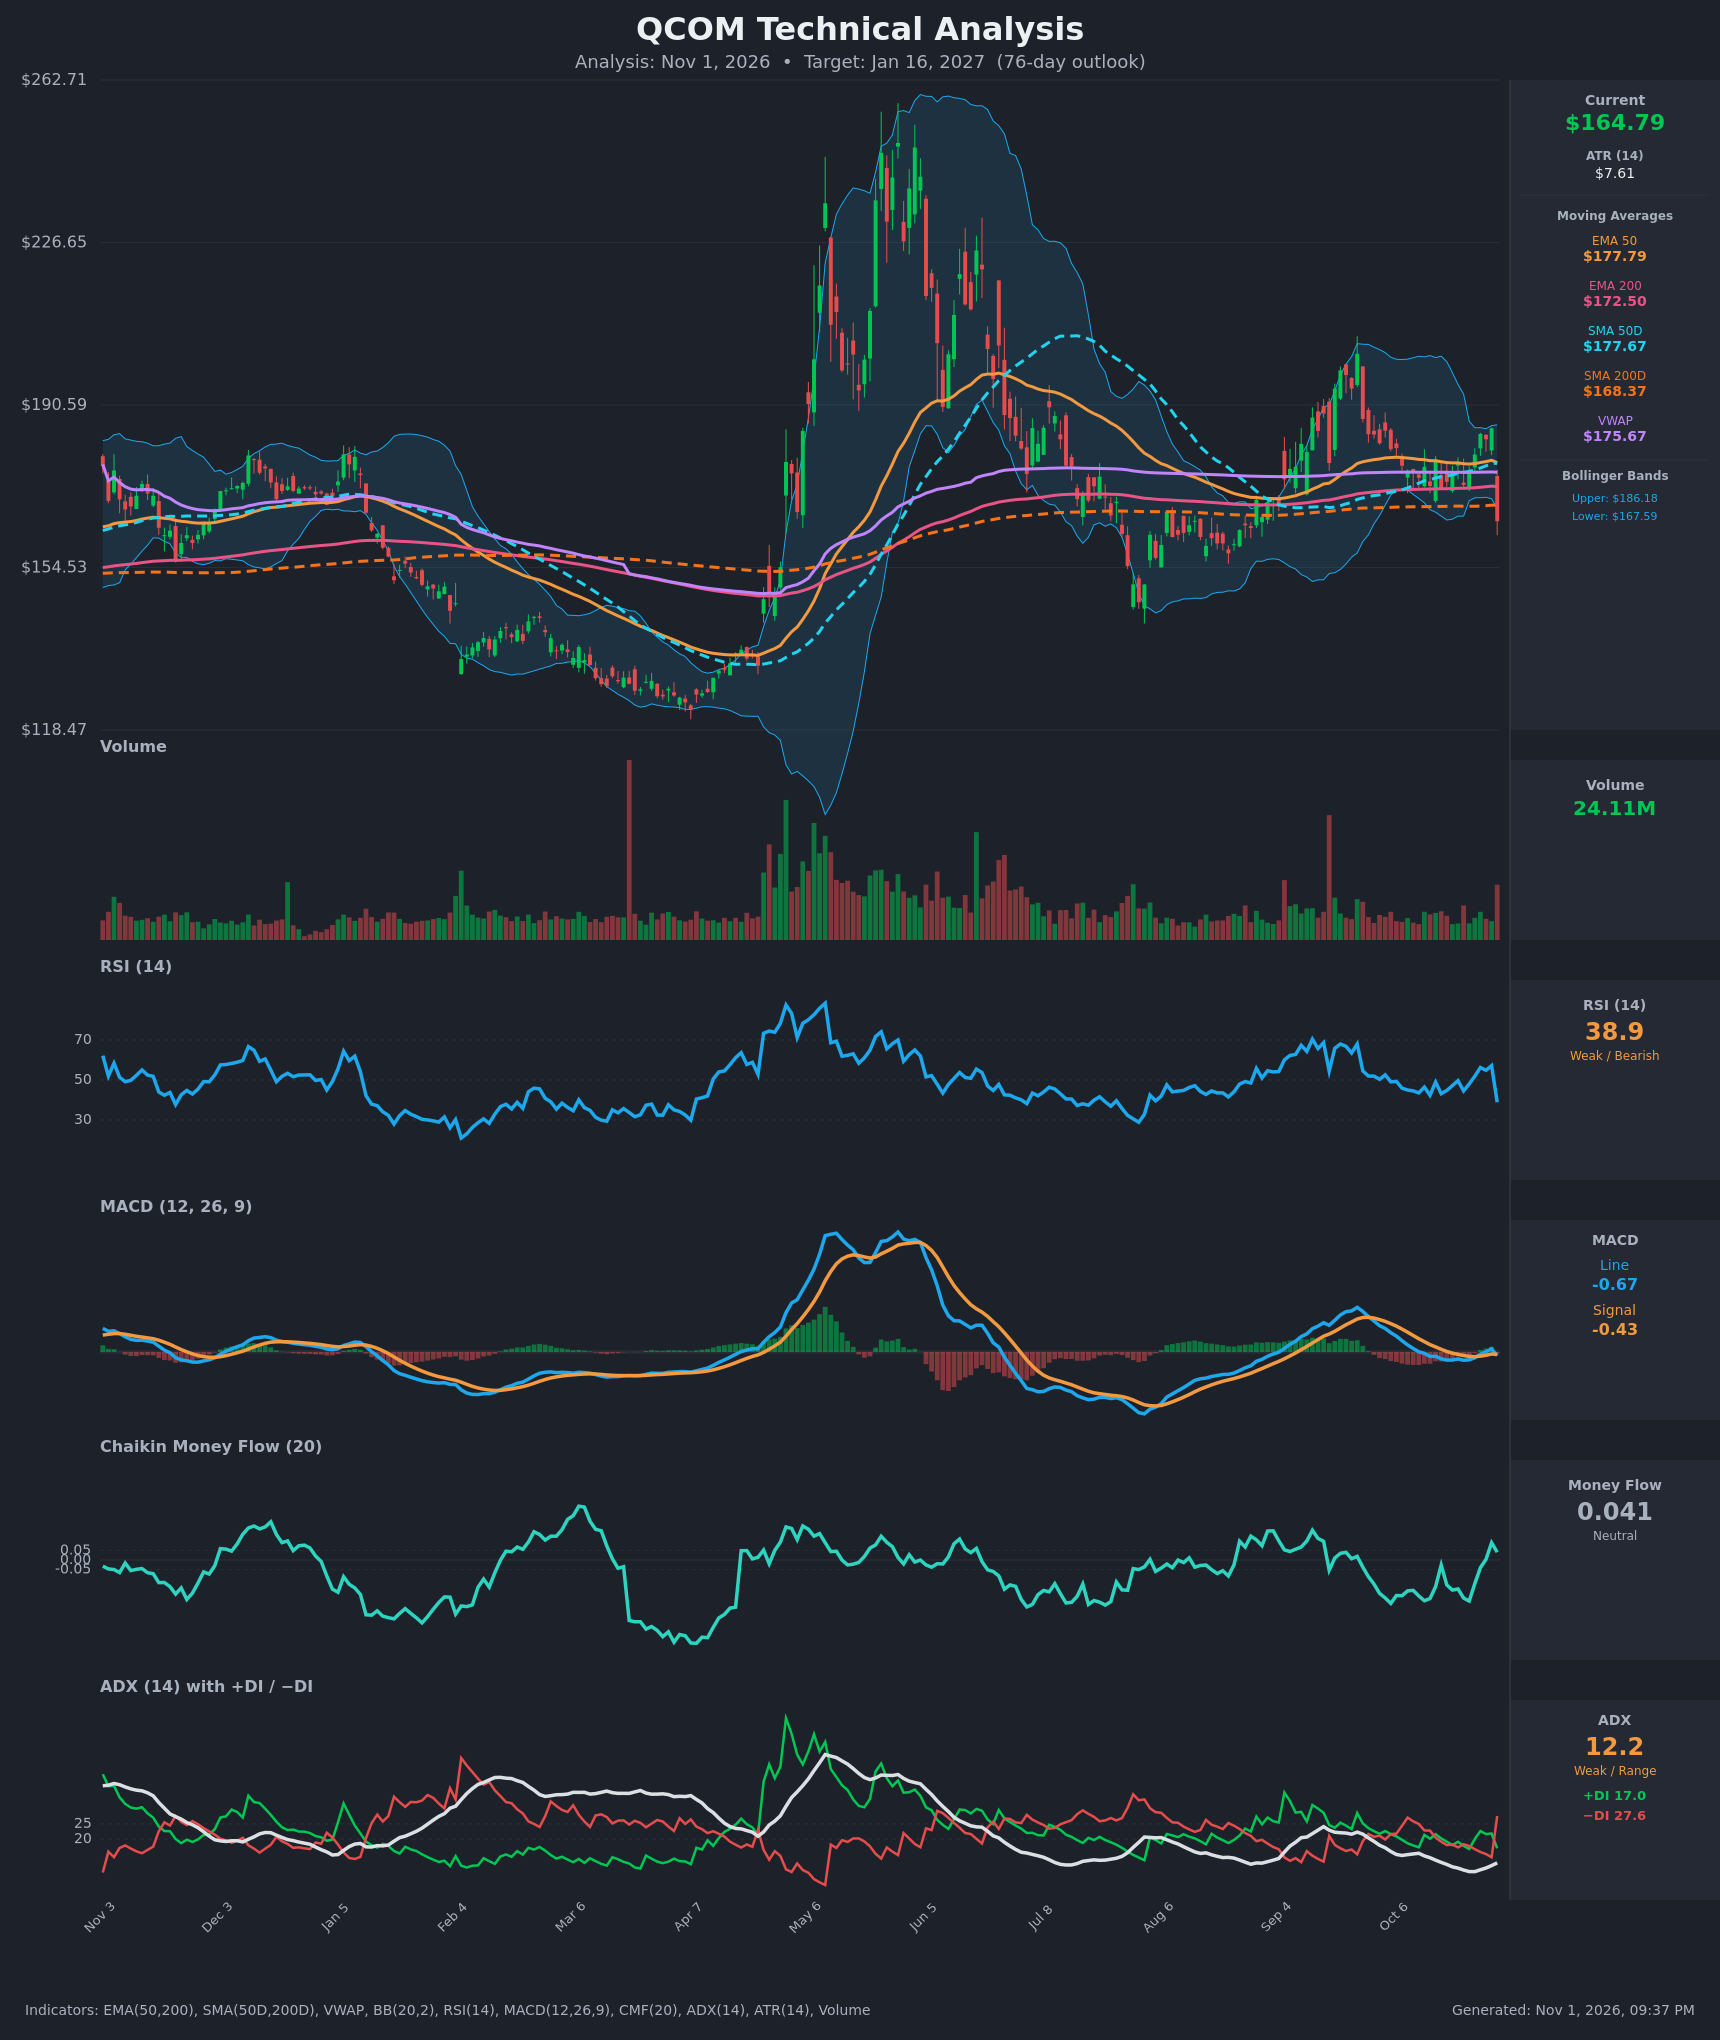
- RSI (14): 38.86, down sharply from 57.2 the prior day. That is a 18-point one-day drop, and it sits below the 50 midline but is not yet oversold (<30). Momentum is turning down. [Bearish]
- 20 EMA: Not provided. The nearest proxies are the EMA 50 at $177.79 and VWAP at $175.67. Price at $164.79 sits well below both, which makes them overhead resistance. [Bearish]
- MACD: Line -0.665 vs signal -0.428, a fresh bearish crossover after the line briefly turned positive (+0.569) on Oct 29. The histogram is negative (about -0.24) and both lines are near zero, so the momentum shift is mild but clearly down. [Bearish]
- Bollinger Bands (20): Upper $186.18, lower $167.59. Price closed below the lower band after a gap-down from near the upper band. That is a stretched, mean-reversion-prone reading, but it is also a volatility-expansion break to the downside. [Bearish]
- CMF (20): 0.041, inside the neutral band (-0.05 to +0.05). It rose from -0.2 to slightly positive during the October rally, but the latest high-volume drop will pull it lower. Accumulation is not confirmed. [Neutral]
- ADX (14): 12.2, very weak and range-bound. −DI (27.6) jumped above +DI (17.0) from a 15.1 vs 21.8 reading the day before, a sharp bearish DI flip. The trend is not established yet, but the bears have taken control. [Weak Trend + Bearish direction]
- Volume: 24.11M, one of the larger recent bars and attached to a roughly -11% red candle. That points to a news or earnings-driven distribution day. [Bearish – heavy selling]
DIVERGENCES & TRENDS
- There is no clean divergence. RSI and price both made lower lows on the final bar. The October rally to $185 came with a lower RSI peak (~57) than September (~70), so momentum had been fading before the drop.
- The price highs are stepping down: $262 (May) → ~$205 (Sep) → ~$185 (Oct). That is a series of lower highs.
- The MAs are bunched together: EMA50 $177.79, SMA50D $177.67, VWAP $175.67, EMA200 $172.50, SMA200D $168.37. EMA50 and SMA50D sit above the 200s, so there is no death cross and the structure is not decisively bearish. Price has now lost every one of them, including the SMA200D at $168.37, which is the first break of long-term support.
- The MACD bearish crossover and the DI flip happened on the same day, which reinforces the downside signal.
- The ADX at 12 says the market has been range-bound. The gap-down is a range-low test, not yet a confirmed new downtrend.
CHART PATTERNS
- No textbook pattern from the reference sheet fits cleanly. The best fit is a wide, choppy range (~$143–$185) with lower highs, which resembles a Bearish Expanding Triangle in character.
- The failed rally to the $185 area (upper Bollinger Band and EMA50/SMA50D cluster) followed by a gap-down breaks the short-term higher-low sequence from Aug–Oct.
- If the range-low zone of $155–$160 breaks, the measured downside points toward the Aug low area (~$143–$145). If that zone holds, price likely stays in the range.
POTENTIAL SCENARIOS
- Scenario 1: Bearish Post-Gap Drift Lower — The post-earnings gap-down is followed by continued selling, with failed bounces at the $168–$172 MA cluster (SMA200D/EMA200). Price retests the $155 zone and possibly the mid-$140s. Trigger: a daily close below the Oct 30 low and failure to reclaim $168.37. Target: $155–$158, extended to $145. Invalidation: a daily close above $177.7 (EMA50/SMA50D). (45% probability)
- Scenario 2: Bullish Mean-Reversion Recovery — Price is below the lower Bollinger Band with a neutral-to-positive CMF, so a rebound into the old range is plausible, with the gap partly filling. Trigger: a reclaim of $168.37 and then $172.50 on rising volume. Target: $175–$180 (VWAP, EMA50). Invalidation: a close below $155. (35% probability)
- Scenario 3: Neutral Range Chop — Price oscillates between $155 and $172 as ADX stays under 20. Trigger: repeated closes between the support and MA resistance. Target: about $160–$168. Invalidation: a close beyond either boundary. (20% probability)
PRICE TARGETS
- Target Price: $159.00 (76 days, Jan 16, 2027)
- Expected Range: $144.00 to $177.00. The width is $33, or about 20% of the current price, which fits the 61–180 day guidance of 18–30%.
- Key Levels: Support at $155.00, Resistance at $168.37 (SMA200D), with further resistance at $172.50 (EMA200).
OVERALL BIAS
OVERALL BIAS: BEARISH - Price broke below every moving average (including the SMA200D) on a heavy-volume gap-down. −DI flipped above +DI, the MACD crossed down, and the October rally formed another lower high. The oversold-band stretch and weak ADX temper conviction, so a bounce toward $168–$172 is likely to be sold.
This is educational analysis and not financial advice.