SMCI 76-day bearish forecast — Nov 1, 2026
- Bias: Bearish
- Timeframe: 76 days (made Nov 1, 2026, target date Jan 15, 2027)
- Price at analysis: $32.95
- Price target: $30.50
- Expected range: $27.00 – $36.50
- Result: Pending — graded after the close on Jan 15, 2027
Get a free AI analysis of SMCI today
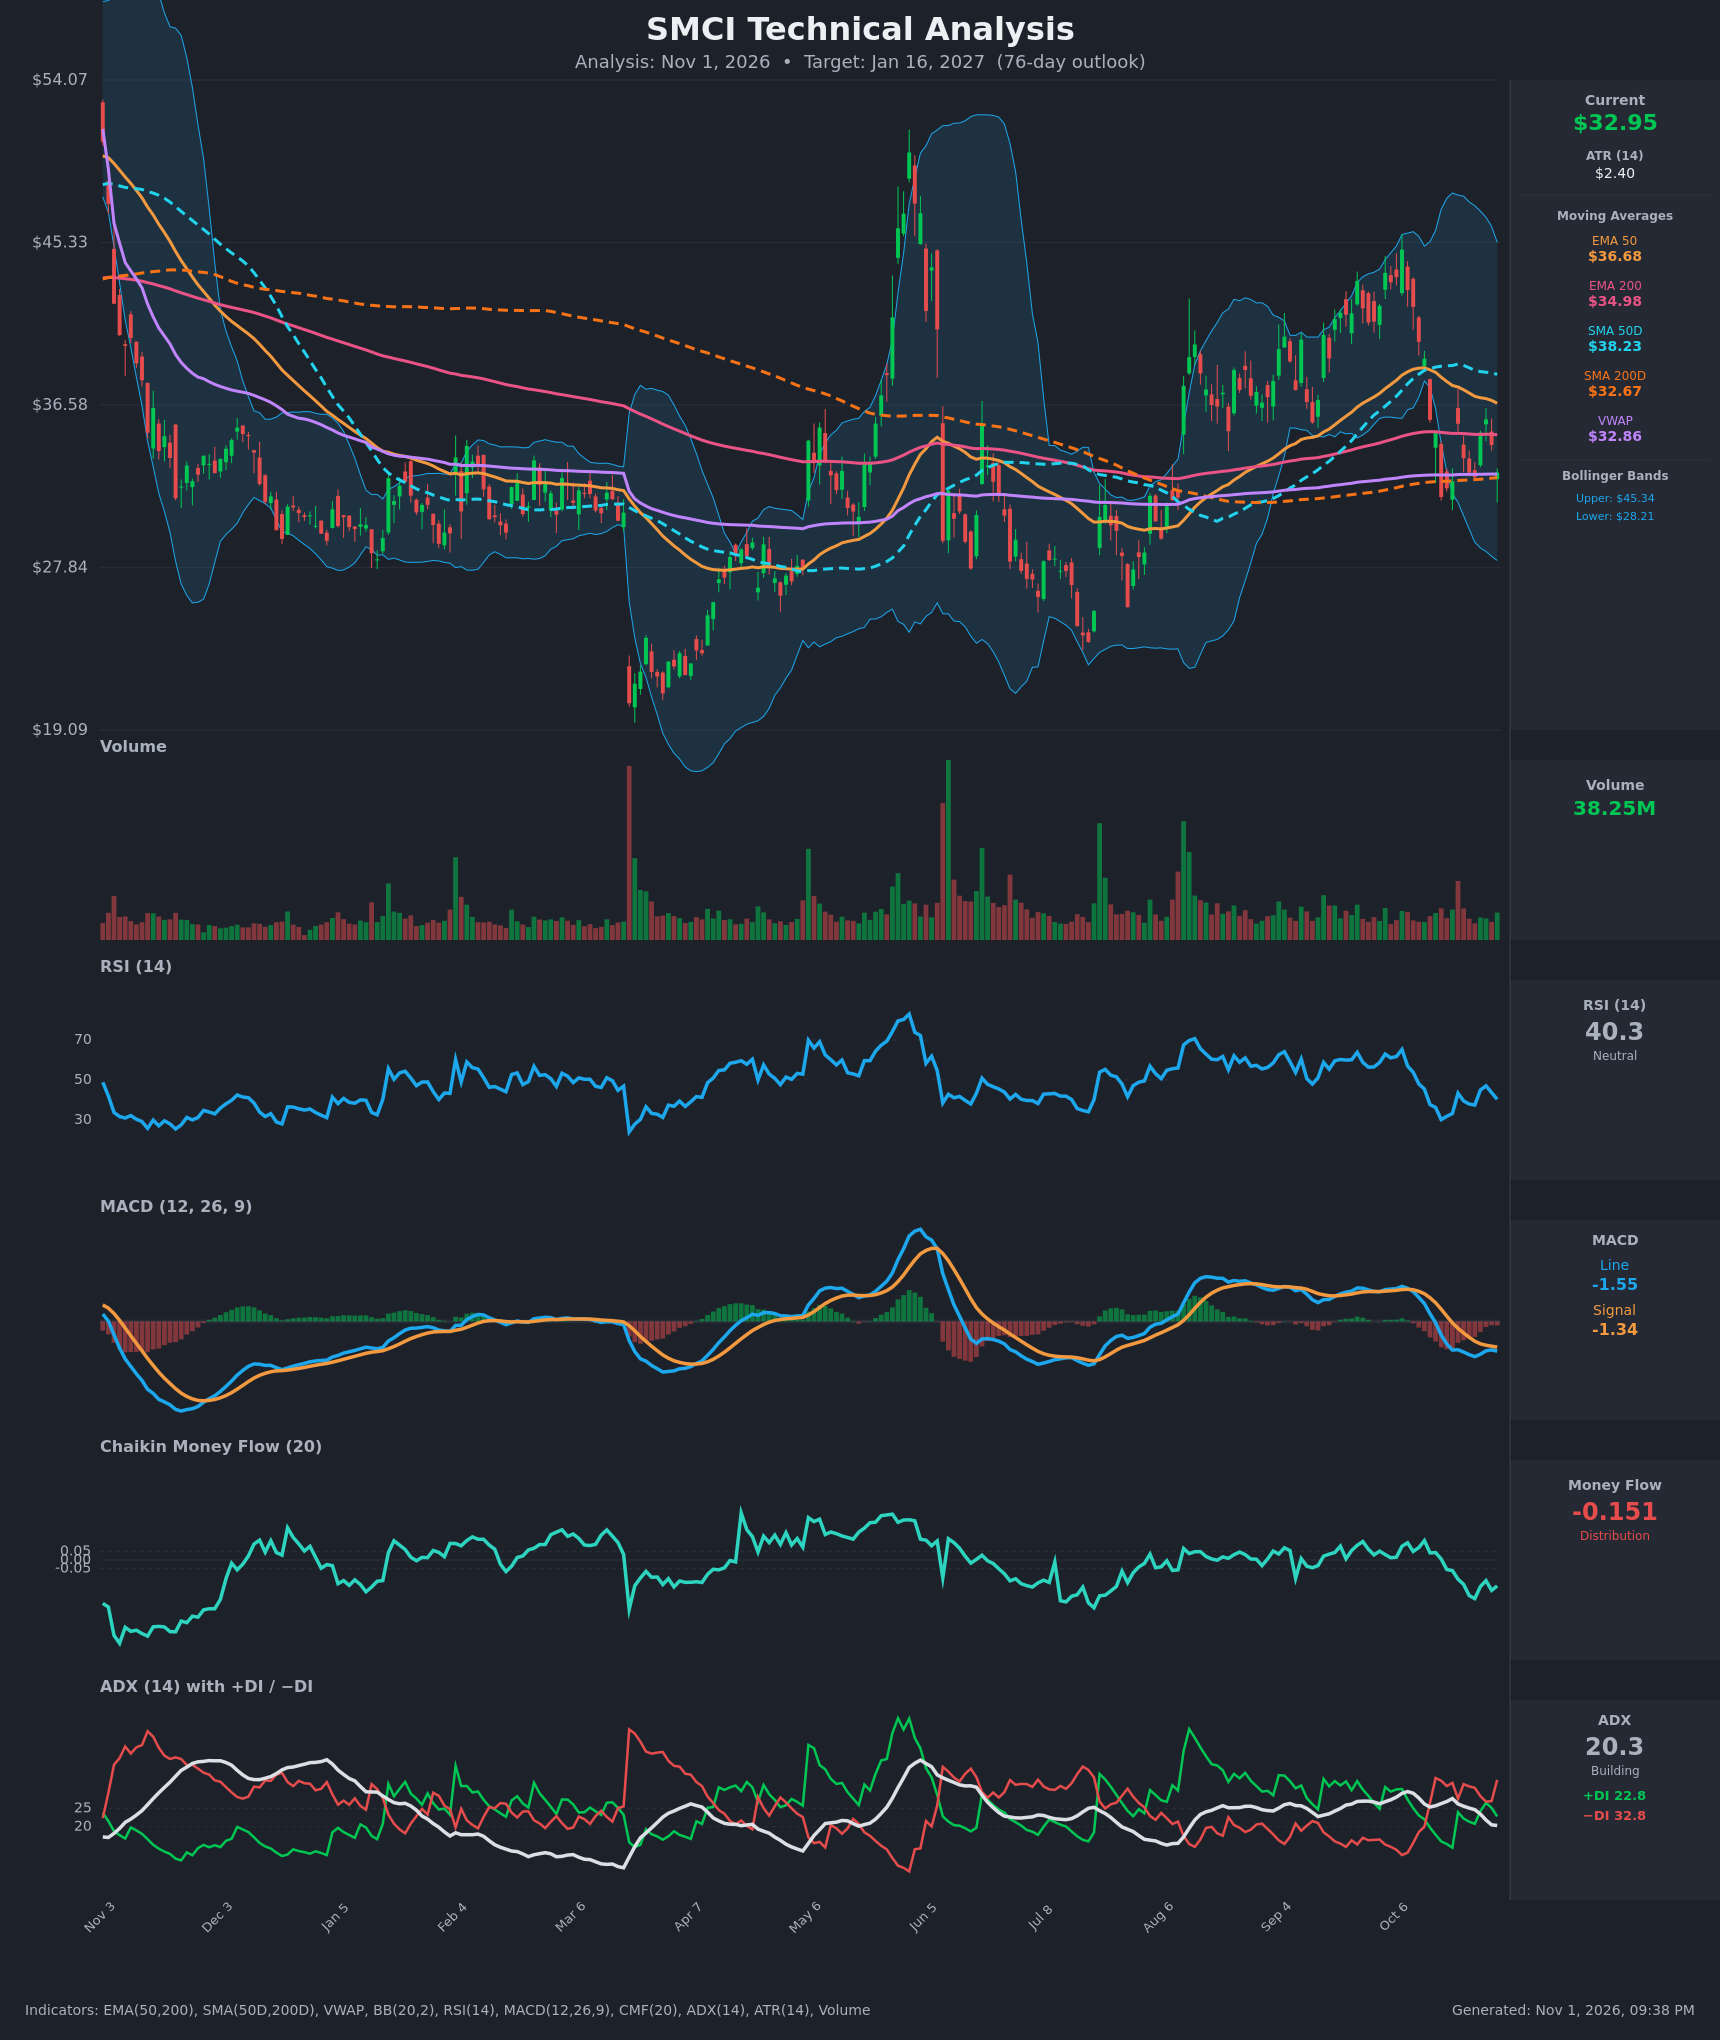
Analysis
TECHNICAL INDICATORS
- RSI (14): 40.35, below the 50 midline and recovering from near-oversold (30.2 on Oct 16). It bounced to 47 and has rolled over again, so momentum is soft with lower highs. [Bearish]
- 20 EMA: The 20 EMA is not provided. Price of $32.95 sits below the EMA 50 ($36.68) and EMA 200 ($34.98), which are acting as overhead resistance. The short-term average is likely just above price after the recent lower highs. [Bearish]
- MACD: Line -1.55 is below signal -1.34, with a mildly negative histogram. The bearish crossover happened around Oct 20, and both lines are below zero and still drifting lower. [Bearish]
- Bollinger Bands (20): Upper $45.34, lower $28.21, so the midline is about $36.78. Price is in the lower half, well above the lower band. The bands are wide, which reflects high volatility after the October sell-off from about $40 and gives no squeeze signal. [Bearish]
- CMF (20): -0.151, well below -0.05 and trending lower from +0.11 on Oct 13. This is clear distribution. [Distribution]
- ADX (14): 20.3 and falling from about 28, so trend strength is weak and borderline. −DI (32.8) is above +DI (22.8), so bears have directional control, but the trend lacks conviction. [Weak Trend, Bearish Direction]
- Volume: 38.25M, roughly average with no climactic selling. Heavy-volume spikes on the chart have come mostly on big swings, and the current bar adds no confirmation of a reversal. [Neutral to Mildly Bearish]
DIVERGENCES & TRENDS
- No clear divergence: RSI made a higher low (about 30 to 37.5) against a roughly flat price low near $31.6-$32.7. That is a mild, early positive sign but not a confirmed divergence.
- Moving averages: SMA50D ($38.23) is above SMA200D ($32.67), so no death cross has formed. The SMA50D is rolling over, and the gap is narrowing. EMA50 ($36.68) is above EMA200 ($34.98) but also declining, so a bearish EMA cross is possible in the coming weeks.
- Price vs SMA200D: Price is just above the SMA200D ($32.67), which is the key long-term support. It is a thin cushion of about 0.9%.
- VWAP: $32.86, almost exactly at price, so there is no edge from it.
- Directional indicators: −DI crossed above +DI on Oct 14 and has stayed there, apart from a brief reversal on Oct 28. CMF has gone from positive to clearly negative.
- Structure: Price has made lower highs ($40 → $35.8) since the mid-October peak. The chart shows a long range between roughly $27 and $45.
CHART PATTERNS
- Descending/Bearish Pennant (loose): After the sharp drop from $40 to $31.6, price has bounced in a tight, low-momentum range ($31.6-$35.8) with lower highs. This resembles a bearish pennant or flag continuation. A break below $31.6 targets about $27-$28, which is the measured move of the flagpole and the prior swing lows.
- Large range: The broader chart shows a multi-month range between about $27 and $45. Mid-range and SMA200D support near $32.7 are the key pivot.
- Significance: A hold above $31.6 keeps a possible double bottom or range-bound structure alive, with a recovery toward $36-$37 (EMA50 and the Bollinger midline). The indicator weight favors continuation lower.
POTENTIAL SCENARIOS
- Scenario 1: Bearish Pennant Breakdown — Price loses the SMA200D and the $31.6 swing low as distribution continues and MACD stays negative. Trigger: daily close below $31.60. Target: $27.50-$28.50, near the lower Bollinger Band and prior range lows. Invalidation: daily close above $36.70 (EMA50). (50% probability)
- Scenario 2: Neutral Range Chop — Price holds the SMA200D and oscillates between about $30 and $36 as ADX stays weak. Trigger: repeated defense of $31.6-$32.7 with lower volume. Target: $31-$35. Invalidation: close below $30 or above $37. (25% probability)
- Scenario 3: Bullish Relief Recovery — RSI higher low and a hold at the SMA200D spark a rebound toward EMA200 and EMA50. Trigger: close above $35.80 with CMF turning positive. Target: $37-$39 (EMA50, SMA50D). Invalidation: close below $31.60. (25% probability)
PRICE TARGETS
For the 76-day timeframe, the range width should be about 18-30% of the current price. The expected range is $27.00 to $36.50, a width of $9.50, or 28.8% of $32.95, which fits the guidance.
- Target Price: $30.50 (76 days)
- Expected Range: $27.00 to $36.50
- Key Levels: Support at $31.60, Resistance at $36.68
OVERALL BIAS
OVERALL BIAS: BEARISH - Price is below the EMA 50 and EMA 200 with a bearish MACD cross, −DI dominant and CMF showing clear distribution (-0.151). The bearish-pennant structure points to a drift toward $27-$30 if the SMA200D and the $31.60 low fail, though weak ADX caps conviction.
This is educational analysis and not financial advice.