TQQQ 76-day bearish forecast — Nov 1, 2026
- Bias: Bearish
- Timeframe: 76 days (made Nov 1, 2026, target date Jan 15, 2027)
- Price at analysis: $62.01
- Price target: $57.50
- Expected range: $50.50 – $65.50
- Result: Pending — graded after the close on Jan 15, 2027
Get a free AI analysis of TQQQ today
Analysis
TECHNICAL INDICATORS
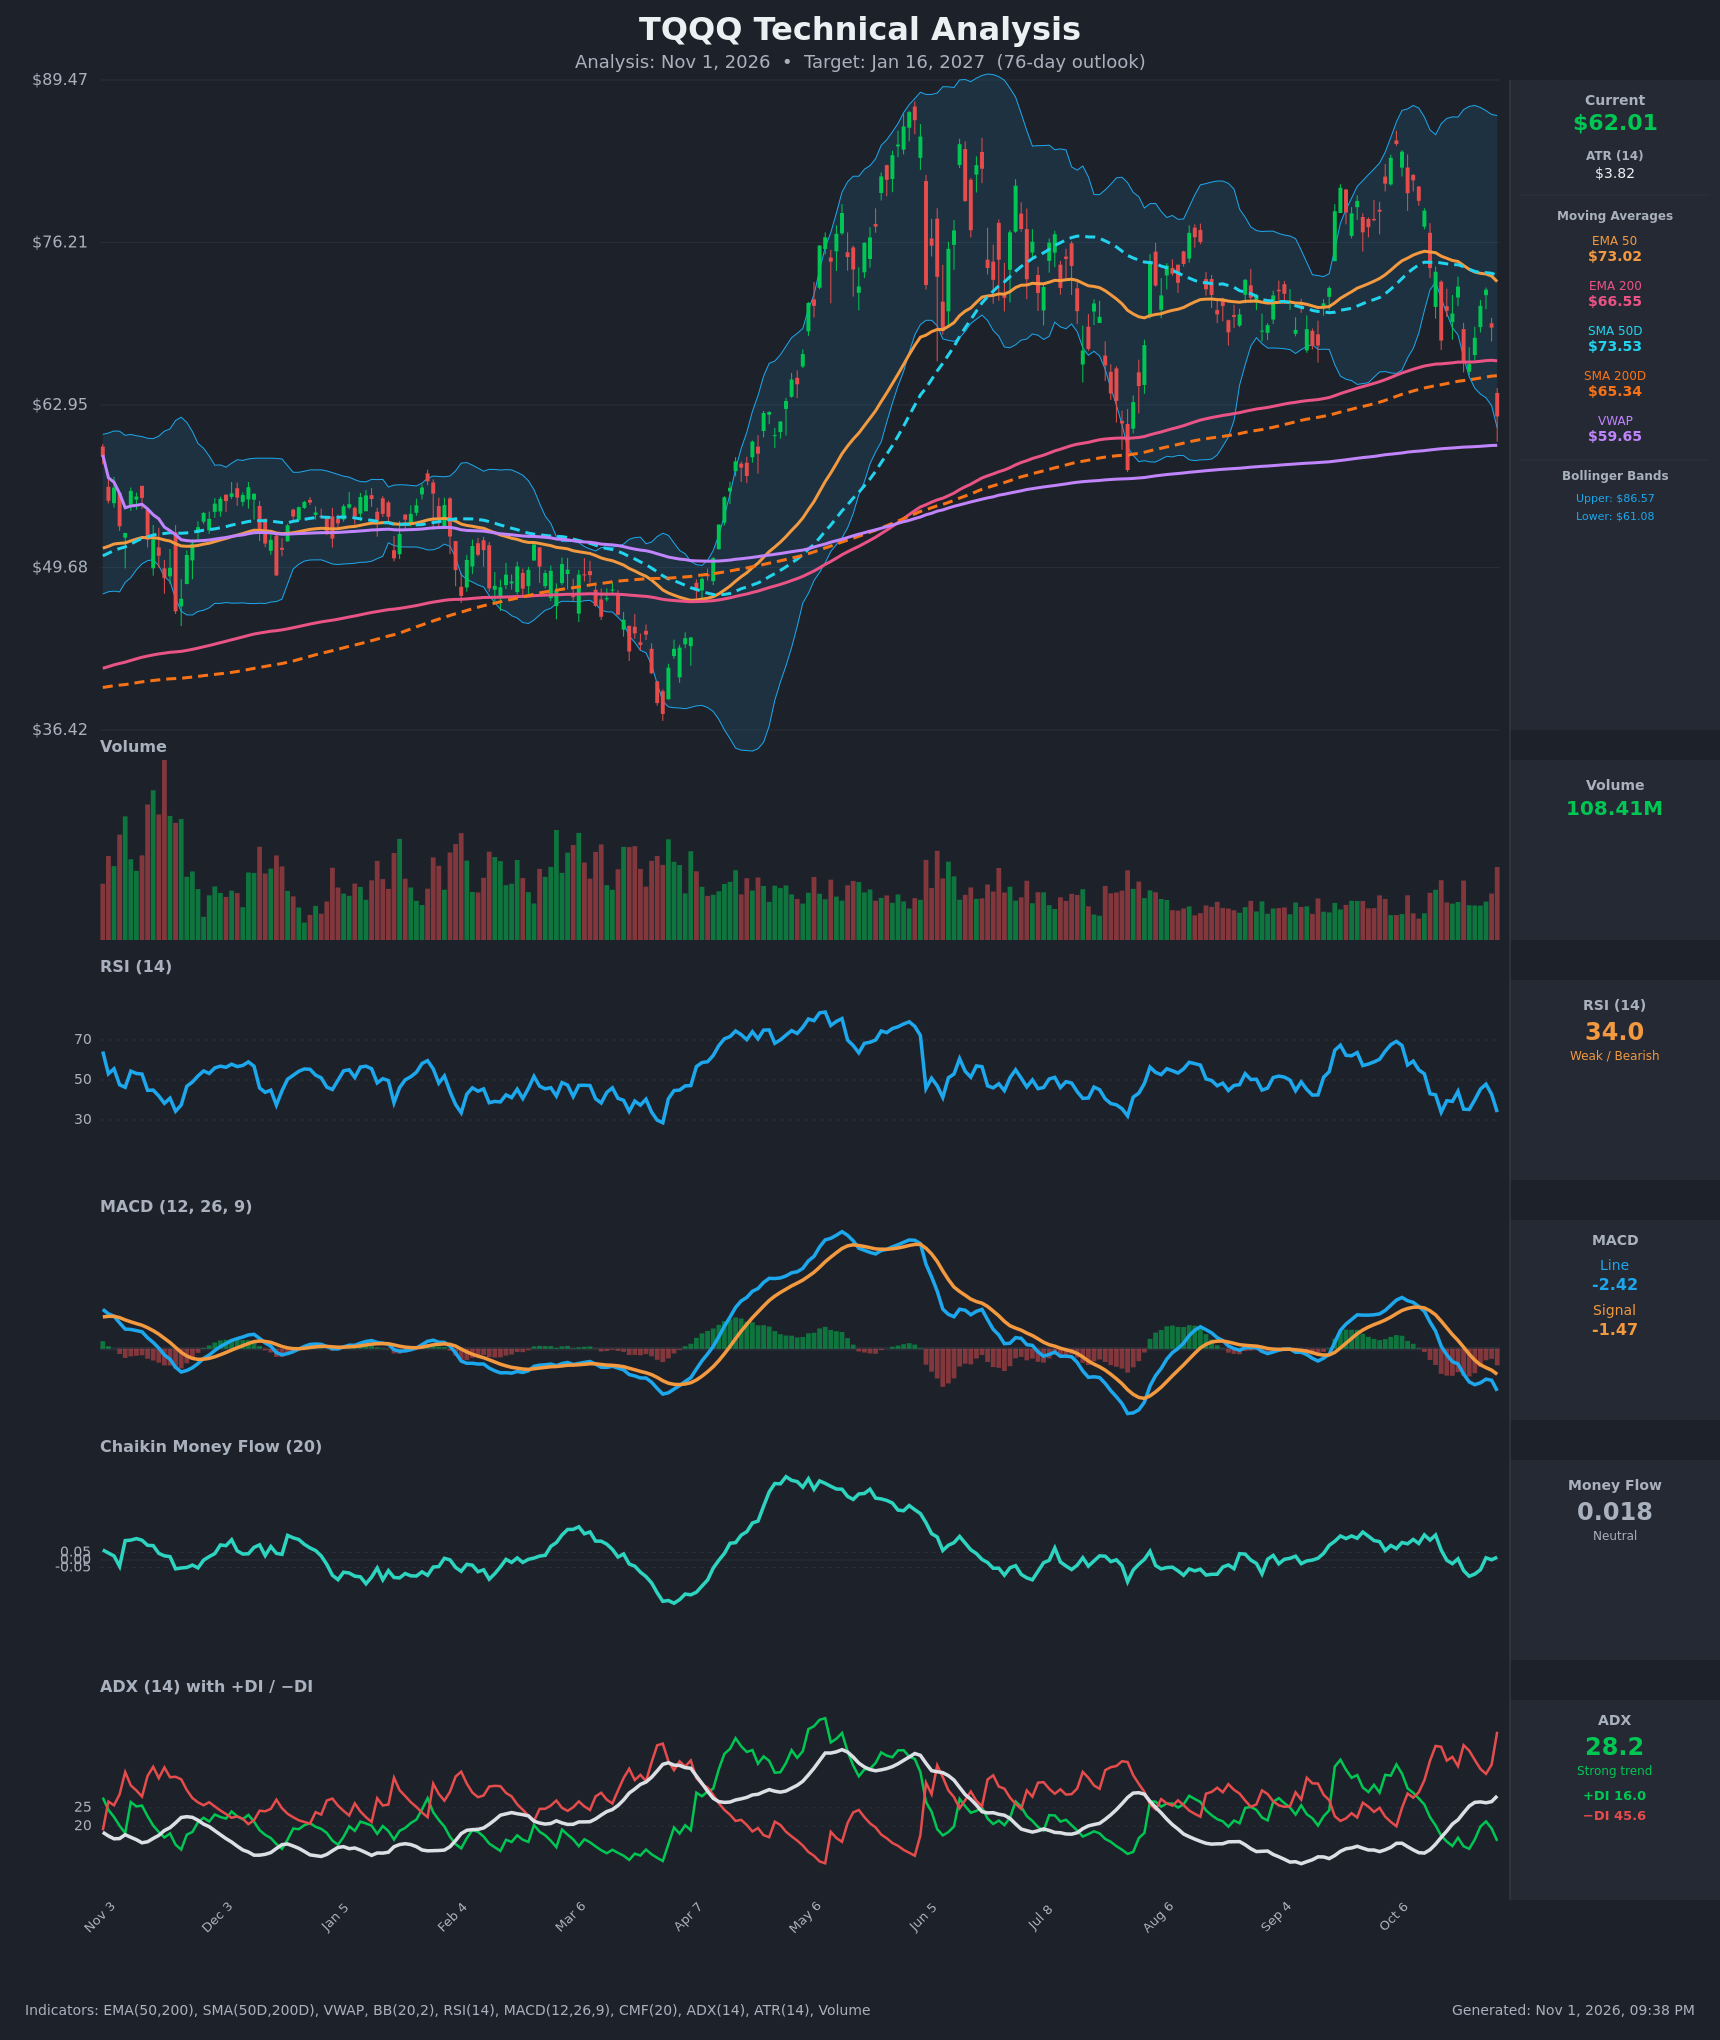
- RSI (14): 33.96, just above oversold (30) after a drop from 55 on Oct 12. Momentum is falling, and the chart shows no bullish divergence yet. [Bearish]
- 20 EMA: The 20 EMA is not supplied. The nearest references are the EMA 50 at $73.02 and the EMA 200 at $66.55. Price at $62.01 is below both, and both now act as overhead resistance. The EMA 50 is rolling over. [Bearish]
- MACD: The line (-2.42) is below the signal (-1.47) and falling. It crossed bearishly around Oct 22 and has been below zero since Oct 19. The histogram is deepening negative, so downside momentum is still expanding. [Bearish]
- Bollinger Bands (20): Price at $62.01 sits almost on the lower band ($61.08) in a very wide band ($86.57 upper), which signals high volatility. A band-walk to the downside is possible. A short-term bounce toward the midline is also plausible, but the midline is near $73. [Bearish]
- CMF (20): 0.018, inside the ±0.05 neutral zone. It has drifted from 0.167 (Oct 15) to flat. There is no accumulation supporting a bounce, but no heavy distribution either. [Neutral]
- ADX (14): 28.2 and rising. −DI (45.6) is far above +DI (16.0), so bears are clearly in control of a strong, established downtrend. [Strong Trend – Bearish]
- Volume: 108.41M, among the heavier recent bars, on a large red candle that took price from $69.26 to $62.01 (-10.5%). Heavy volume on the breakdown confirms selling pressure. [Bearish / Distribution on the break]
DIVERGENCES & TRENDS
- No bullish RSI or MACD divergence is visible. RSI is making a lower low in line with price (Oct 16 at 33.9, now 34.0), so momentum confirms the decline.
- Moving averages: The EMA 50 and SMA 50D (~$73) are rolling over. Price has lost the EMA 200 ($66.55) and SMA 200D ($65.34) in one session. The 50/200 averages are still above each other, so there is no death cross yet, but the gap is narrowing.
- DI and ADX: −DI has been above +DI since Oct 12–13, and ADX has climbed from 12.7 to 28.2, so a new trend has formed.
- CMF: It has faded from +0.17 to neutral, so buying pressure has dried up.
- VWAP: Price is just above the VWAP at $59.65. This is the nearest support and a likely magnet.
CHART PATTERNS
- Bearish triple top / range breakdown: Since September, price has made repeated highs near $80–85 and then rolled over. It has now broken below the $66–72 consolidation floor, which resembles the Bearish Triple Top and Bearish Double Top from the reference. The measured move points toward the mid-$50s.
- Lower highs: The sequence of highs from the May peak (~$89) to the Oct highs (~$83) is progressively lower, which is a bearish structural signal.
- Support to watch: The Aug low (~$57–58) and the March–April base (~$37–50) are the main downside zones. A rebound would face the $65.34 and $66.55 moving averages as resistance.
POTENTIAL SCENARIOS
- Scenario 1: Bearish Trend Continuation — The breakdown below the 200-day averages follows through, with a drift to the VWAP and the Aug low zone, and rallies fade at the $65–67 moving averages. Trigger: daily close below $59.65 (VWAP). Target: $57.50, with an extension to about $52. Invalidation: daily close above $67 (EMA 200). (50% probability)
- Scenario 2: Bullish Oversold Rebound — RSI is near 30 and price is at the lower Bollinger Band, so a mean-reversion bounce is possible, reclaiming the 200-day averages. Trigger: close above $65.34 with RSI above 45 and a MACD histogram turn. Target: $70–73 (EMA 50 / SMA 50D zone). Invalidation: failure at $66.55 and a close below $59. (33% probability)
- Scenario 3: Neutral Base-Building Chop — Price consolidates between the VWAP and the 200-day averages. Trigger: ADX falling below 20 with an inside range. Target: $60–65. Invalidation: close outside $57–$67. (17% probability)
PRICE TARGETS
- Target Price: $57.50 (76 days out)
- Expected Range: $50.50 to $65.50 (width $15.00, about 24% of the current price, in line with the 61–180 day guidance)
- Key Levels: Support at $59.65 (VWAP, then $57.00), Resistance at $65.34 (SMA 200D, then $66.55)
OVERALL BIAS
OVERALL BIAS: BEARISH - Price broke below both 200-day averages on heavy volume. −DI (45.6) dominates +DI (16.0) with ADX at 28.2 and rising, and MACD is negative and expanding. Oversold conditions raise the odds of a bounce, but the evidence favors a drift toward the high-$50s.
This is educational analysis and not financial advice.