WMT 76-day bullish forecast — Nov 1, 2026
- Bias: Bullish
- Timeframe: 76 days (made Nov 1, 2026, target date Jan 15, 2027)
- Price at analysis: $123.51
- Price target: $128.00
- Expected range: $113.00 – $137.00
- Result: Pending — graded after the close on Jan 15, 2027
Get a free AI analysis of WMT today
Analysis
TECHNICAL INDICATORS
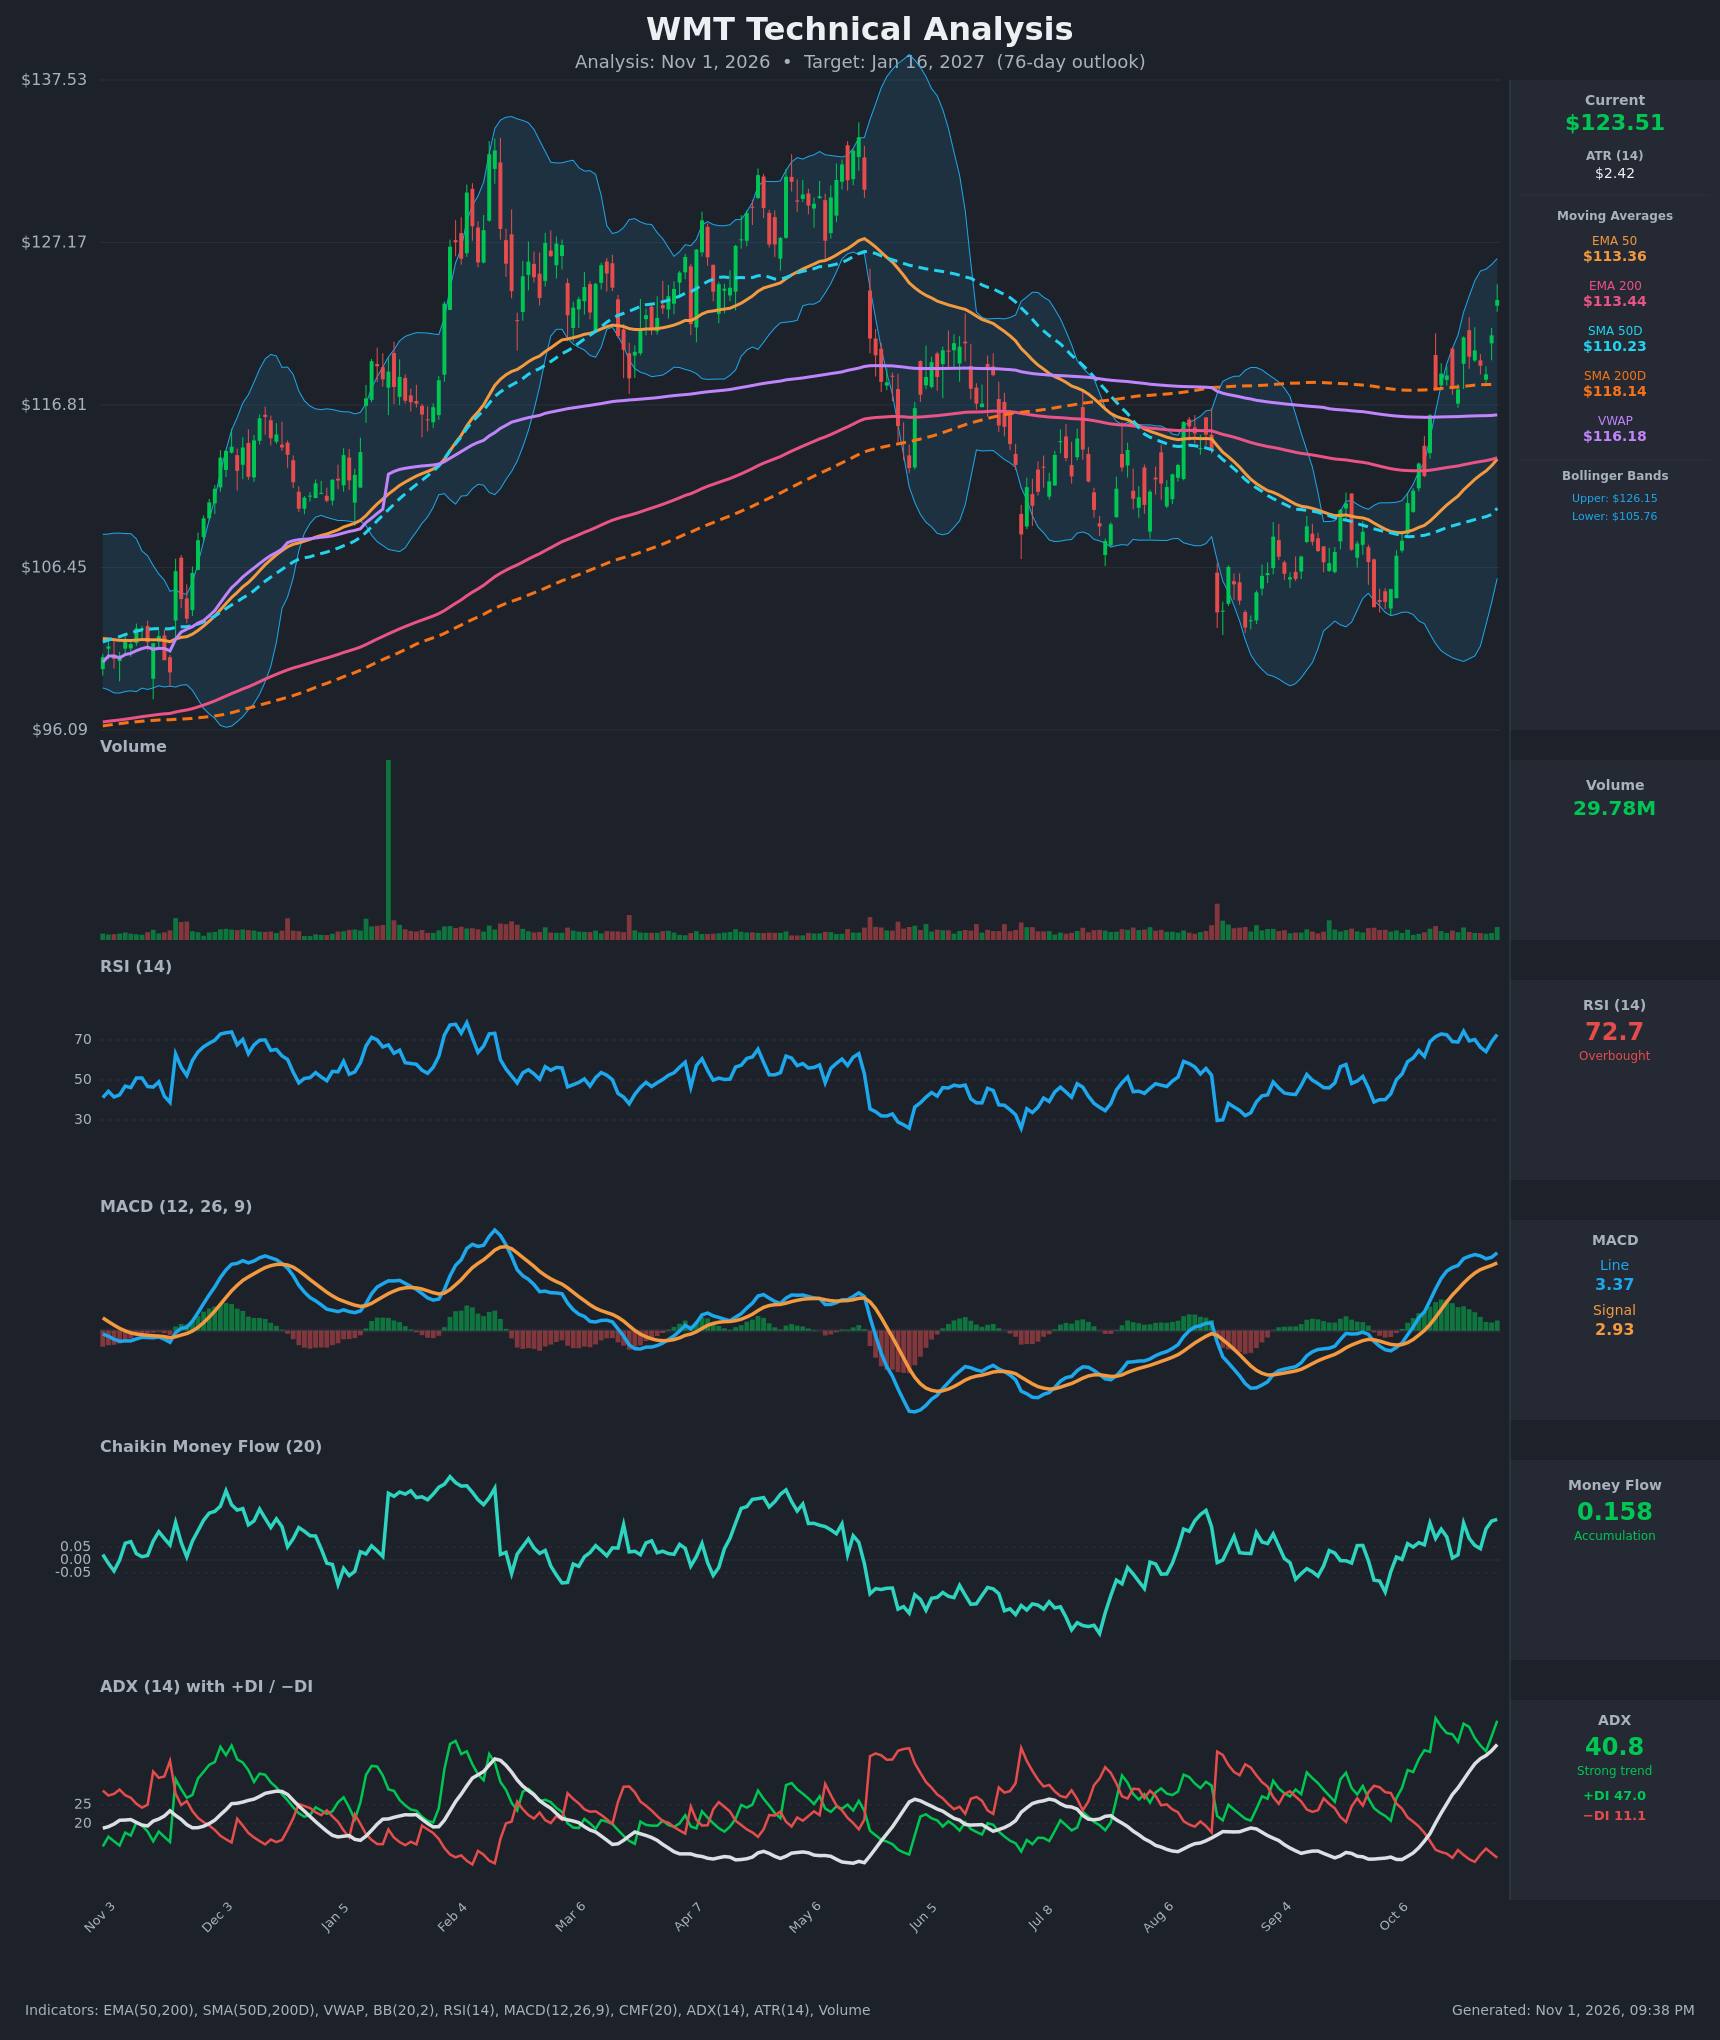
- RSI (14): 72.74, overbought, after oscillating between 64 and 74 for the last 15 bars. It has stayed pinned near 70 since mid-October, which is typical of a strong trend, but it also raises short-term pullback risk. [Bullish] (momentum strong, stretched)
- 20 EMA: The 20 EMA isn't provided, but the EMA 50 ($113.36) and EMA 200 ($113.44) are about to cross bullishly, with the EMA 50 rising steeply. Price sits about 9% above both and well above VWAP ($116.18). The SMA 200D at $118.14 has been reclaimed and is now support. [Bullish]
- MACD: Line 3.37 is above signal 2.93, with a positive histogram (about +0.44) that ticked up on the last bar. The bullish crossover happened in early-to-mid October and the line is making new highs. [Bullish]
- Bollinger Bands (20): Upper $126.15, lower $105.76. Price at $123.51 is in the upper quarter of the band, and the bands are widening, which signals volatility expansion in the direction of the trend. Being near the upper band with an overbought RSI suggests the move is extended. [Bullish]
- CMF (20): 0.158, well above +0.05 and positive on all 15 bars. This shows sustained accumulation and confirms the rally with real buying pressure. [Accumulation]
- ADX (14): 40.8 and rising steadily from 13.7 on Oct 12, with +DI 47.0 far above −DI 11.1. This is a strong, accelerating uptrend, though an ADX above 40 sometimes precedes trend exhaustion or consolidation. [Strong Trend + Bullish]
- Volume: 29.78M, above the typical daily bars on the chart but well below the huge spike seen in January. The rally from the October lows has come on healthy participation, which supports the breakout. [Confirming the uptrend]
DIVERGENCES & TRENDS
- There is no bearish divergence yet. MACD, ADX and CMF are all making higher highs alongside price.
- RSI is lingering near 70-74 rather than rising, a mild sign of momentum saturation, but it is not a divergence.
- The EMA 50 is converging on the EMA 200 ($113.36 vs $113.44). A bullish EMA crossover looks imminent, and it follows a spread that narrowed from about $3.6 on Oct 12.
- The SMA 50D ($110.23) is still below the SMA 200D ($118.14), so a golden cross has not occurred. It would take sustained gains to close that gap, though the SMA 50D is rising.
- Price has broken above the SMA 200D, VWAP and the late-summer range highs (about $118-121), turning the long-term structure from downtrend to recovery.
- The ADX +DI/−DI spread is very wide (47 vs 11), a bullish trend signature.
CHART PATTERNS
- Bullish Double Bottom: Lows near $103-104 in August and again in early October, with a neckline around $118. The breakout above the neckline is confirmed. The measured move is about $15 above the neckline, giving roughly $133, which is also near the prior swing highs of $132-134.
- Bullish continuation after a flag-like consolidation: The tight $117-121 range in mid-to-late October resolved higher on Oct 29-30.
- Resistance zone: The $133-134 area marks the prior highs from February and May. An approach there may stall the rally, since the market could form a double top. The chart does not show that yet.
POTENTIAL SCENARIOS
- Scenario 1: Bullish Trend Continuation — The ADX and DI structure, positive CMF and MACD, and the double-bottom measured move all point higher. Price likely digests the overbought RSI with shallow dips and keeps climbing. Trigger: hold above $120 and close above the upper Bollinger Band ($126.15). Target: $128-133. Invalidation: daily close below $118. (50% probability)
- Scenario 2: Neutral Consolidation and Pullback, Then Resume — With RSI above 70 and price near the upper band, a mean-reversion pullback toward the VWAP/SMA 200D area is common before the next leg. Trigger: rejection near $126-127 and RSI falling below 60. Target: $116-121 retest, then a recovery to about $124-126 by the end of the period. Invalidation: a break above $127 on volume, or a drop below $115. (30% probability)
- Scenario 3: Bearish Failed Breakout — The rally fails at resistance, the bullish EMA cross whipsaws, and price slides back into the prior range. Trigger: close below $116 with MACD crossing below signal. Target: $110-113 (SMA 50D / EMA cluster). Invalidation: reclaim of $121. (20% probability)
PRICE TARGETS
- Target Price: $128.00 (76 days, Jan 16, 2027)
- Expected Range: $113.00 to $137.00. The width is $24, or about 19.4% of the current price, which is within the 18-30% guidance for 61-180 days.
- Key Levels: Support at $118.00 (SMA 200D, with VWAP at $116.18 below it), Resistance at $133.00 (prior highs and double-bottom measured move; the upper Bollinger Band at $126.15 is the first hurdle)
OVERALL BIAS
OVERALL BIAS: BULLISH - A strong, accelerating uptrend (ADX 40.8, +DI 47 vs −DI 11), a positive MACD, sustained CMF accumulation, a reclaimed SMA 200D and an imminent bullish EMA 50/200 cross all support further upside. The overbought RSI argues for a possible pullback along the way.
This is educational analysis and not financial advice.