TLT 76-day bullish forecast — Nov 1, 2026
- Bias: Bullish
- Timeframe: 76 days (made Nov 1, 2026, target date Jan 15, 2027)
- Price at analysis: $81.84
- Price target: $83.60
- Expected range: $74.00 – $90.50
- Result: Pending — graded after the close on Jan 15, 2027
Get a free AI analysis of TLT today
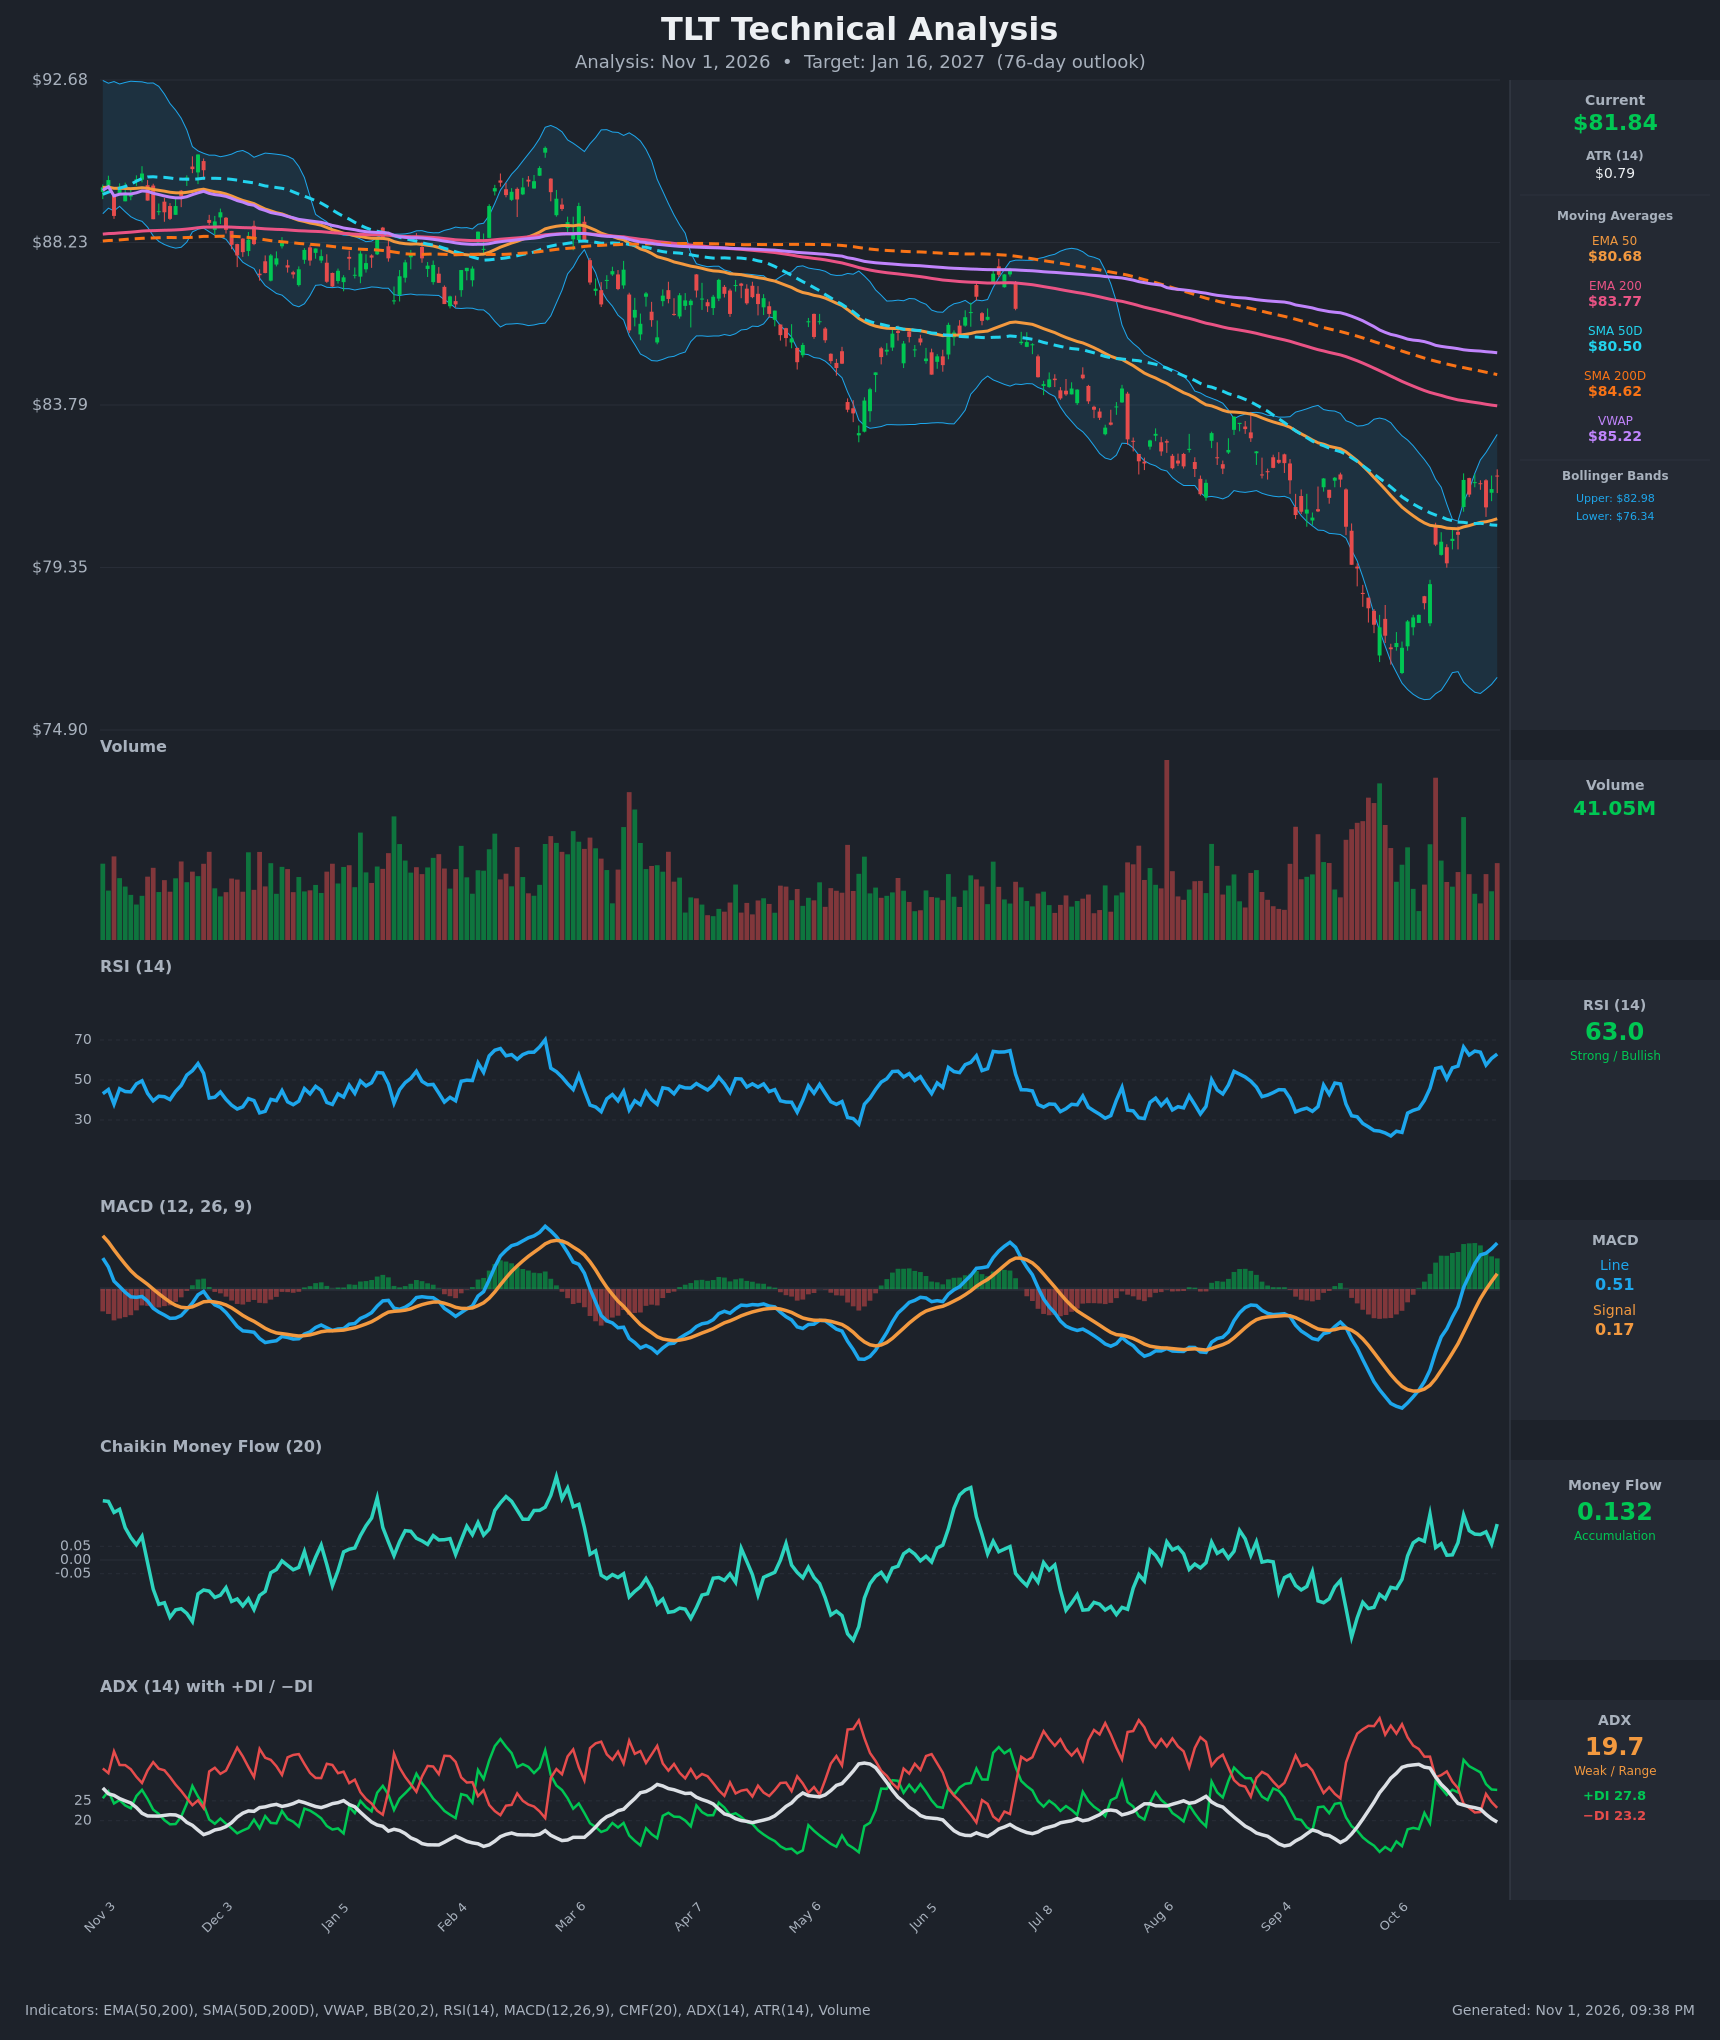
Analysis
TECHNICAL INDICATORS
- RSI (14): 62.98, up from about 35.7 on Oct 12 and now in bullish territory below the 70 overbought line. Momentum has turned up sharply, but it is approaching the zone where TLT stalled earlier in the year. [Bullish]
- 20 EMA: The 20 EMA isn't plotted, so I use the EMA 50 at $80.68 and SMA 50D at $80.50. Price at $81.84 is above both, and they act as the first support zone. The EMA 50 is flattening and starting to turn up after a long decline. [Bullish]
- MACD: Line 0.506 is above signal 0.169, and the bullish crossover came around Oct 22. The histogram is positive and widening, and the line is above zero for the first time since the spring. The chart shows a V-shaped momentum recovery. [Bullish]
- Bollinger Bands (20): Upper $82.98 and lower $76.34, so price sits in the upper third of the band, about $1.14 below the upper band. After the squeeze and the drop to the lower band near $76, price has snapped back toward the upper half. A walk along the upper band would be bullish, but the middle band (~$79.7) is now well below price. [Bullish]
- CMF (20): 0.132, above +0.05 and positive on every one of the last 15 bars. This shows steady accumulation during the rebound. [Accumulation]
- ADX (14): 19.7 and falling from 34 (below 20 means weak or range-bound). +DI at 27.8 is above −DI at 23.2, so bulls lead the DI battle after the Oct 22 crossover. The prior bearish trend has faded, but no new bullish trend is confirmed. [Weak Trend, bullish DI tilt]
- Volume: 41.05M, in line with recent averages. The capitulation-style volume spikes in September and October (the lows near $76) were followed by a rebound on moderate volume. Participation on the bounce is decent but not a thrust. [Neutral-to-constructive]
DIVERGENCES & TRENDS
- Bullish momentum divergence (late-stage): Price made a lower low near $76 in October. RSI bottomed around 25-30, not far below earlier lows, and MACD turned up sharply. The bounce is momentum-led.
- Moving-average structure remains bearish: EMA 50 ($80.68) is below EMA 200 ($83.77), and SMA 50D ($80.50) is below SMA 200D ($84.62). That is a death-cross configuration, and the gaps are narrowing only slowly. Price is below the SMA 200D and VWAP ($85.22), so the long-term downtrend is intact.
- Crossovers: MACD crossed above signal (bullish) and +DI crossed above −DI (bullish). Price reclaimed the 50-day averages. No golden cross is in sight.
- Overhead resistance cluster: EMA 200 at $83.77, SMA 200D at $84.62 and VWAP at $85.22 form a confluence zone $2–3.5 above price. These falling averages were rejected repeatedly in prior rallies (the March and June peaks).
- Trend of indicators: ADX has fallen from 34 to under 20, so the selling impulse has exhausted itself. CMF has stayed positive, and RSI has made higher lows since mid-October.
CHART PATTERNS
- Bullish Falling Wedge / downtrend-channel breakout (reversal): The year-long series of lower highs and lower lows has been broken to the upside by the October rebound. If the break holds, the typical measured move is a retracement toward the wedge's start, around the $84–86 moving-average confluence.
- Possible Bearish Descending Triangle / continuation: If this rally is only a counter-trend bounce, the lower-high sequence stays intact. A rejection under $84–85 would point to a retest of the $76 lows, and a break below would target the high $60s–low $70s.
- Significance: The first pattern is supported by momentum, CMF and DI. The second is supported by the higher-timeframe MA structure. Neither is fully confirmed until price either clears $84.62 or loses $80.50.
POTENTIAL SCENARIOS
- Scenario 1: Bullish Relief Rally to the 200-Day Zone — Momentum, accumulation and the DI tilt carry price through the upper Bollinger Band and into the EMA 200/SMA 200D area. Price consolidates above the 50-day averages and grinds higher. Trigger: daily close above $82.98 (BB upper), then above $83.77. Target: $83.50–$85.50 (VWAP $85.22 as the extension). Invalidation: close below $80.50 (SMA 50D / EMA 50) on rising volume. (45% probability)
- Scenario 2: Bearish Rejection at Resistance, Retest of Lows — The bounce stalls at the falling 200-day averages and VWAP, in line with the dominant downtrend, and ADX re-expands with −DI on top. Trigger: rejection at $83.77–$85 plus a close below $80.50. Target: $77–$76 first, then $74–$75 if the October low breaks. Invalidation: weekly close above $85.50. (35% probability)
- Scenario 3: Neutral Range Between the 50s and 200s — Weak ADX keeps price oscillating between $80 support and $84 resistance. Trigger: repeated failures on both sides of the range. Target: $80–$84. Invalidation: close outside $79.50–$85.50. (20% probability)
PRICE TARGETS
- Target Price: $83.60 (76-day horizon, around Jan 16, 2027)
- Expected Range: $74.00 to $90.50 (width $16.50, about 20.2% of current price, which fits the 61–180 day guidance of 18–30%)
- Key Levels: Support at $80.50 (SMA 50D / EMA 50 zone), Resistance at $83.77 (EMA 200, with the SMA 200D at $84.62 and VWAP at $85.22 above it)
OVERALL BIAS
OVERALL BIAS: BULLISH - Momentum is clearly improving (MACD bullish cross, RSI 63, CMF +0.13, +DI above −DI), and price has reclaimed the 50-day averages after a capitulation low near $76. The bias is modest, since the falling 200-day averages and VWAP at $83.77–$85.22 are heavy overhead resistance and the long-term trend is still down. That caps the target near the 200-day zone.
This is educational analysis and not financial advice.