TSLA 76-day bullish forecast — Nov 1, 2026
- Bias: Bullish
- Timeframe: 76 days (made Nov 1, 2026, target date Jan 15, 2027)
- Price at analysis: $399.81
- Price target: $424.00
- Expected range: $362.00 – $458.00
- Result: Pending — graded after the close on Jan 15, 2027
Get a free AI analysis of TSLA today
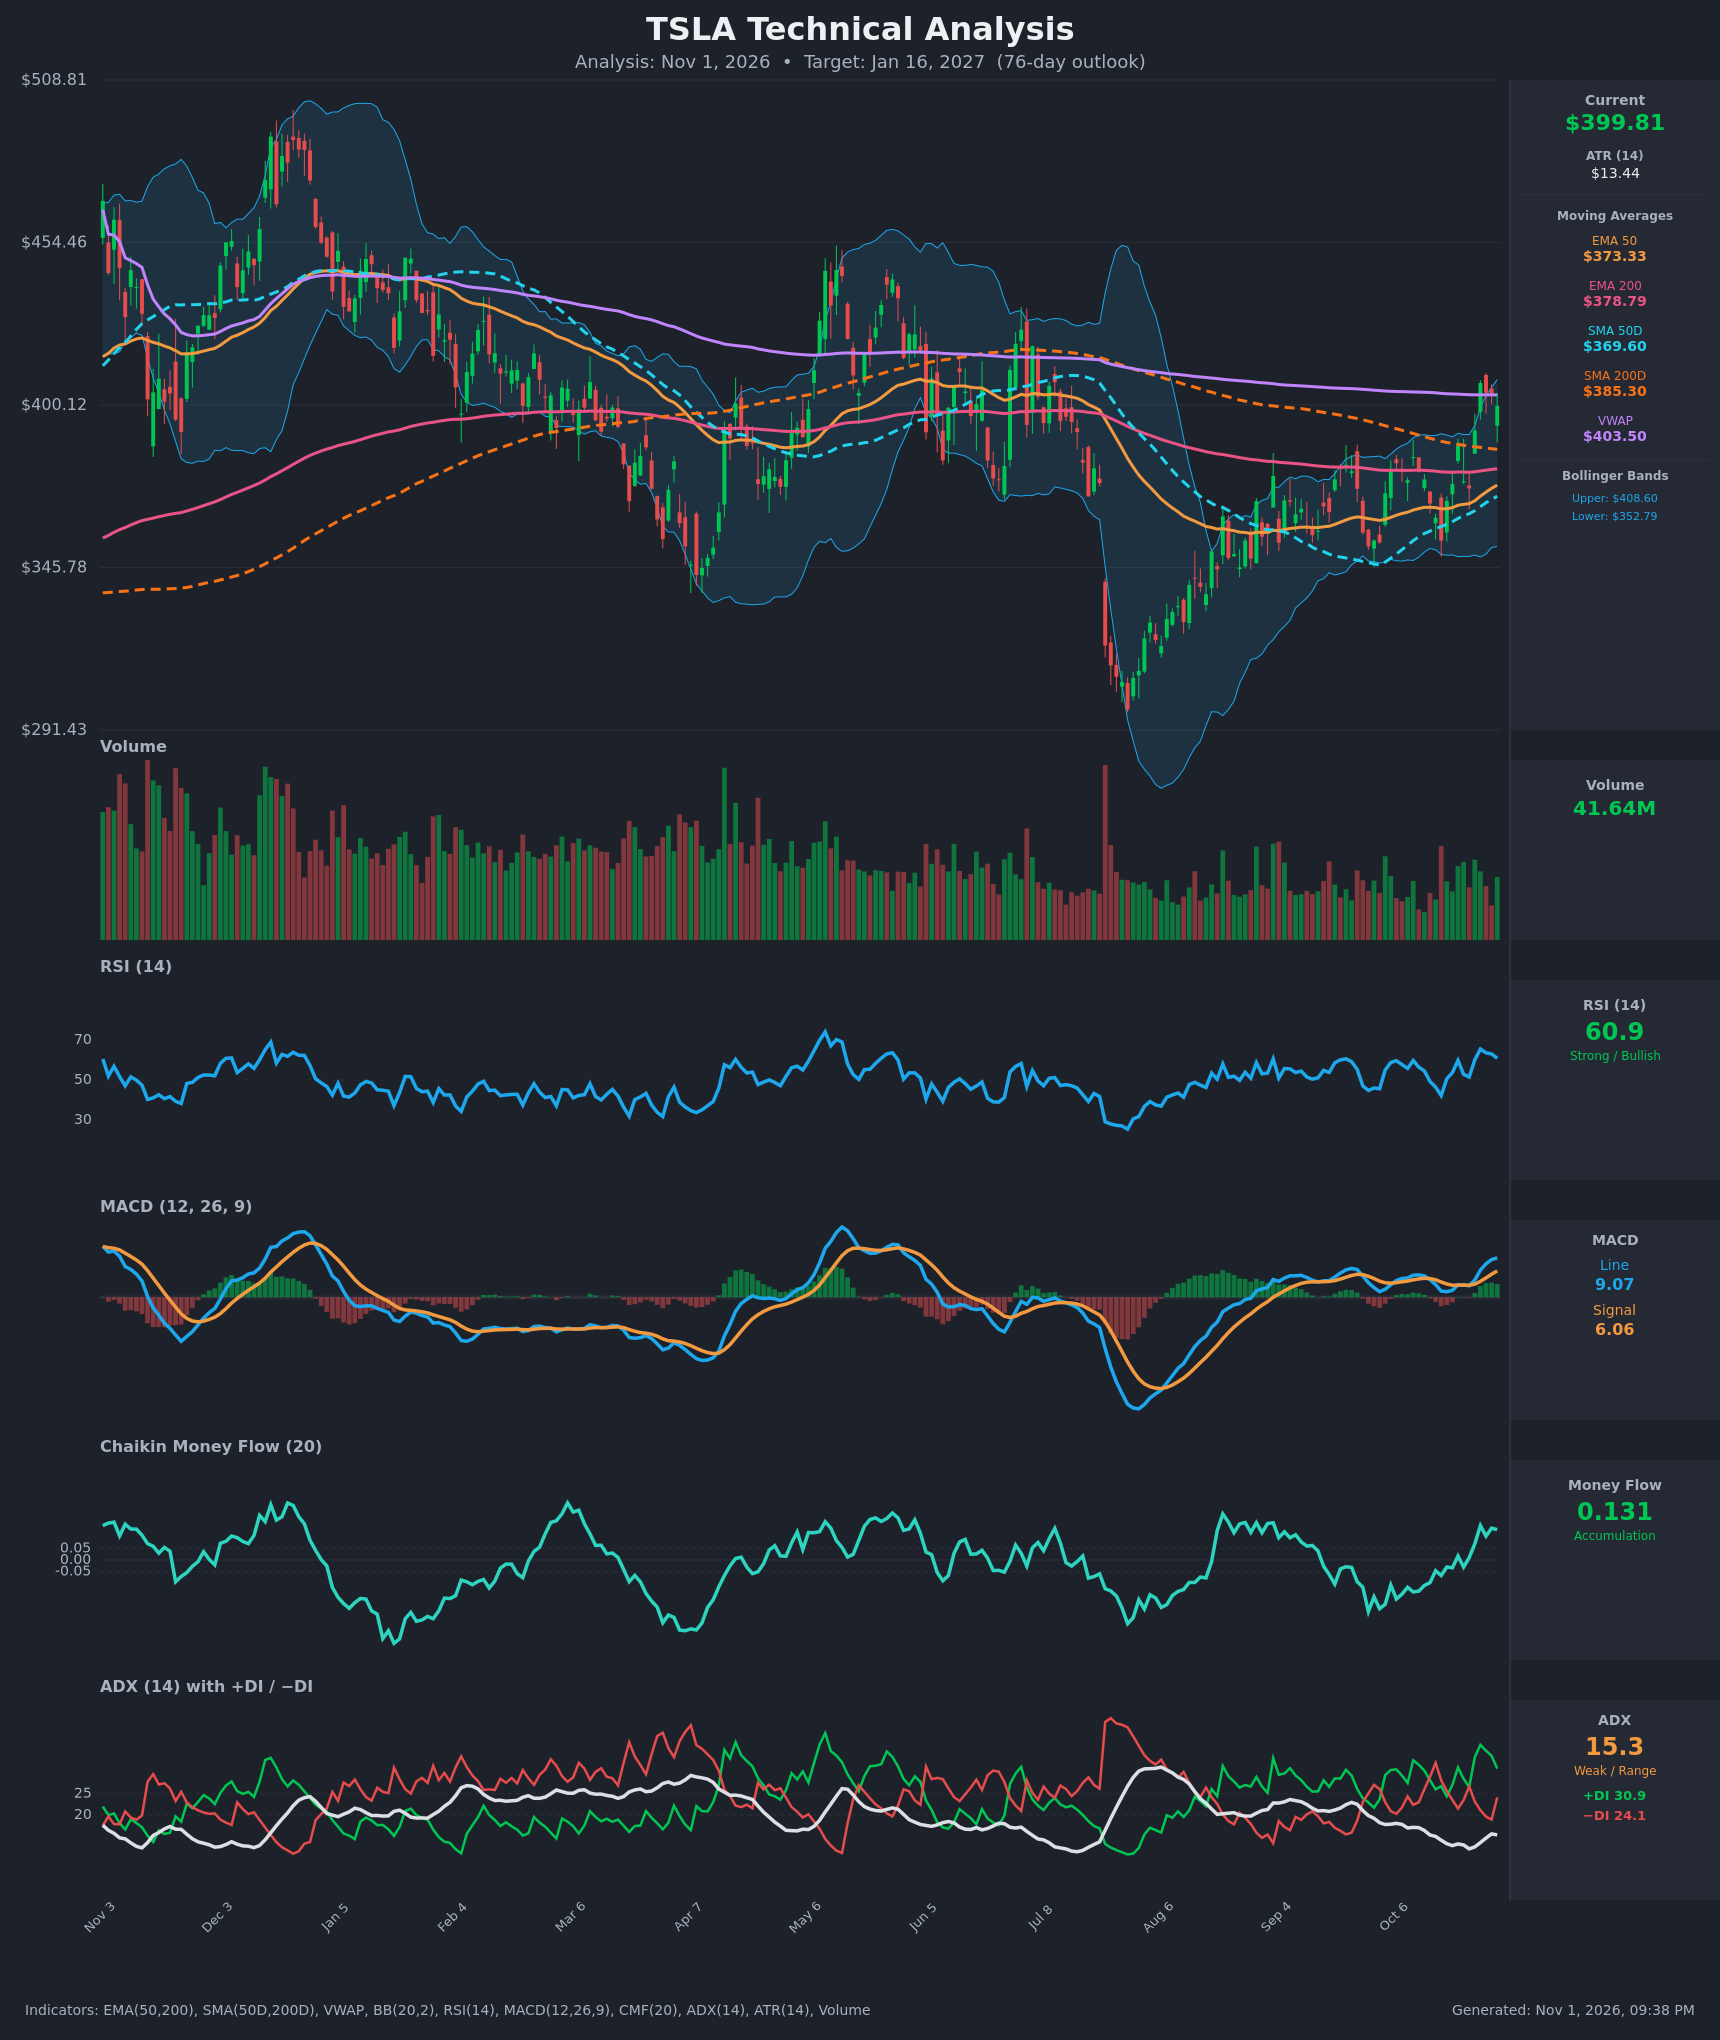
Analysis
TECHNICAL INDICATORS
- RSI (14): 60.86, up from 42 on Oct 16 and just off a 65.5 peak on Oct 27. Momentum is clearly bullish but not overbought, with room to run toward 70. [Bullish]
- 20 EMA: Not supplied. From the chart it sits around $380-385, and price at $399.81 is above it. Price is also above EMA50 ($373.33) and EMA200 ($378.79), so these act as layered support. [Bullish]
- MACD: Line 9.07 is above signal 6.06 with a positive, widening histogram. The bullish crossover came around Oct 21 and the gap has expanded since. The line is at its highest level since the spring rally. [Bullish]
- Bollinger Bands (20): Upper $408.60, lower $352.79, midline about $380.70. Price is in the upper quarter of the bands after bouncing off the lower band on Oct 16. The upper band and the $407.46 high make a near-term ceiling, but a "walk" along the upper band is possible if momentum continues. [Neutral]
- CMF (20): +0.131, well above +0.05 and up from -0.135 on Oct 12. It has been in sustained accumulation for the last several sessions. [Accumulation]
- ADX (14): 15.3 (below 20, so no established trend), drifting lower. +DI 30.9 is above −DI 24.1, so bulls lead the directional balance. However, +DI has been rolling over from 36.5 and −DI is rising, which shows the last pullback is fading buying pressure. [Weak Trend + Bullish tilt]
- Volume: 41.64M, light compared with the heavy volume earlier in the year, and the breakout push above $400 came on only moderate volume. This does not confirm the move strongly. [Neutral / Lacks Confirmation]
DIVERGENCES & TRENDS
- Moving averages: Price has reclaimed EMA200 ($378.79) and SMA200D ($385.30), a medium-term positive. SMA50D ($369.60) is rising toward SMA200D, but there is no golden cross yet. EMA50 ($373.33) is closing in on EMA200 ($378.79) and could cross within weeks, supporting a bullish trend change if price holds.
- Divergences: None clear. RSI, MACD and CMF all confirmed the move up. CMF and MACD have risen sharply while volume stays muted, so the breakout is not yet heavily backed.
- Longer-term structure: Price has made a series of higher lows since the August low near $300, which points to a base. Highs since the spring are lower ($480 → $450 → $407), and VWAP ($403.50) is a falling overhead resistance. A decisive close above VWAP and $408 would break that sequence.
- ADX vs. price: The bounce is happening with ADX near 15, so it is a range-escape attempt rather than a strong trend. Follow-through will need ADX to turn up.
- Recent crossovers: The MACD bullish crossover (Oct 21) and +DI crossing back above −DI (Oct 26) both happened within the last two weeks.
CHART PATTERNS
- Ascending Triangle / bullish base (reference diagram): From September to October, price consolidated between about $345 and $385, with higher lows and a flat ceiling at the $385 SMA200D area. The late-October push through that ceiling resembles an ascending-triangle breakout. The measured move (range height of about $40 added to $385) gives about $425.
- Rounded bottom (not on the diagram): The recovery from the $300 low supports a base. The $407 area is the first major test, where the declining VWAP and the upper Bollinger Band converge.
- Caution: The Oct 27 high of $407.46 was rejected, and price has slipped for three sessions. A retest of $385 is possible before any sustained advance, as in a bullish-flag retest.
POTENTIAL SCENARIOS
- Scenario 1: Bullish Breakout and Trend Shift — Price retests the $385-$392 zone, holds above SMA200D, then clears $408 and VWAP on rising volume. EMA50 crosses above EMA200 and MACD stays positive. Trigger: daily close above $408.60 with volume above 50M. Target: $425, with an extension to $450-$455. Invalidation: daily close below $378 (below EMA200 and the pattern's breakout zone). (50% probability)
- Scenario 2: Bearish Rejection at Resistance — The falling VWAP and $407 high cap the rally, and price slips back into the $345-$385 range as ADX remains weak. Trigger: close below $385 and then below $373 (EMA50). Target: $352-$360 (lower Bollinger Band, prior base lows). Invalidation: close above $410. (30% probability)
- Scenario 3: Neutral Range Chop — Price oscillates between about $375 and $410 for most of the period with no resolution. Trigger: repeated failures at both $408 and $378. Target: $395-$405. Invalidation: close outside the $370-$415 range. (20% probability)
PRICE TARGETS
For the 76-day horizon (through Jan 16, 2027):
- Target Price: $424.00
- Expected Range: $362.00 to $458.00 (width $96, about 24% of current price, consistent with the 61-180 day guidance)
- Key Levels: Support at $385.30 (SMA200D, with EMA200 at $378.79 and EMA50 at $373.33 below), Resistance at $408.60 (upper Bollinger Band and the Oct 27 high zone, with VWAP at $403.50 just below)
OVERALL BIAS
OVERALL BIAS: BULLISH - Price has reclaimed the 200-day averages, with a MACD bullish crossover, rising RSI, positive CMF accumulation, and +DI above −DI. A higher-low base since August supports a measured move toward $425. Weak ADX, light volume, and VWAP/upper-band resistance near $404-$409 keep conviction moderate, and a pullback to $385 is likely along the way.
This is educational analysis and not financial advice.