XLE 76-day bullish forecast — Nov 1, 2026
- Bias: Bullish
- Timeframe: 76 days (made Nov 1, 2026, target date Jan 15, 2027)
- Price at analysis: $70.02
- Price target: $72.50
- Expected range: $61.60 – $77.00
- Result: Pending — graded after the close on Jan 15, 2027
Get a free AI analysis of XLE today
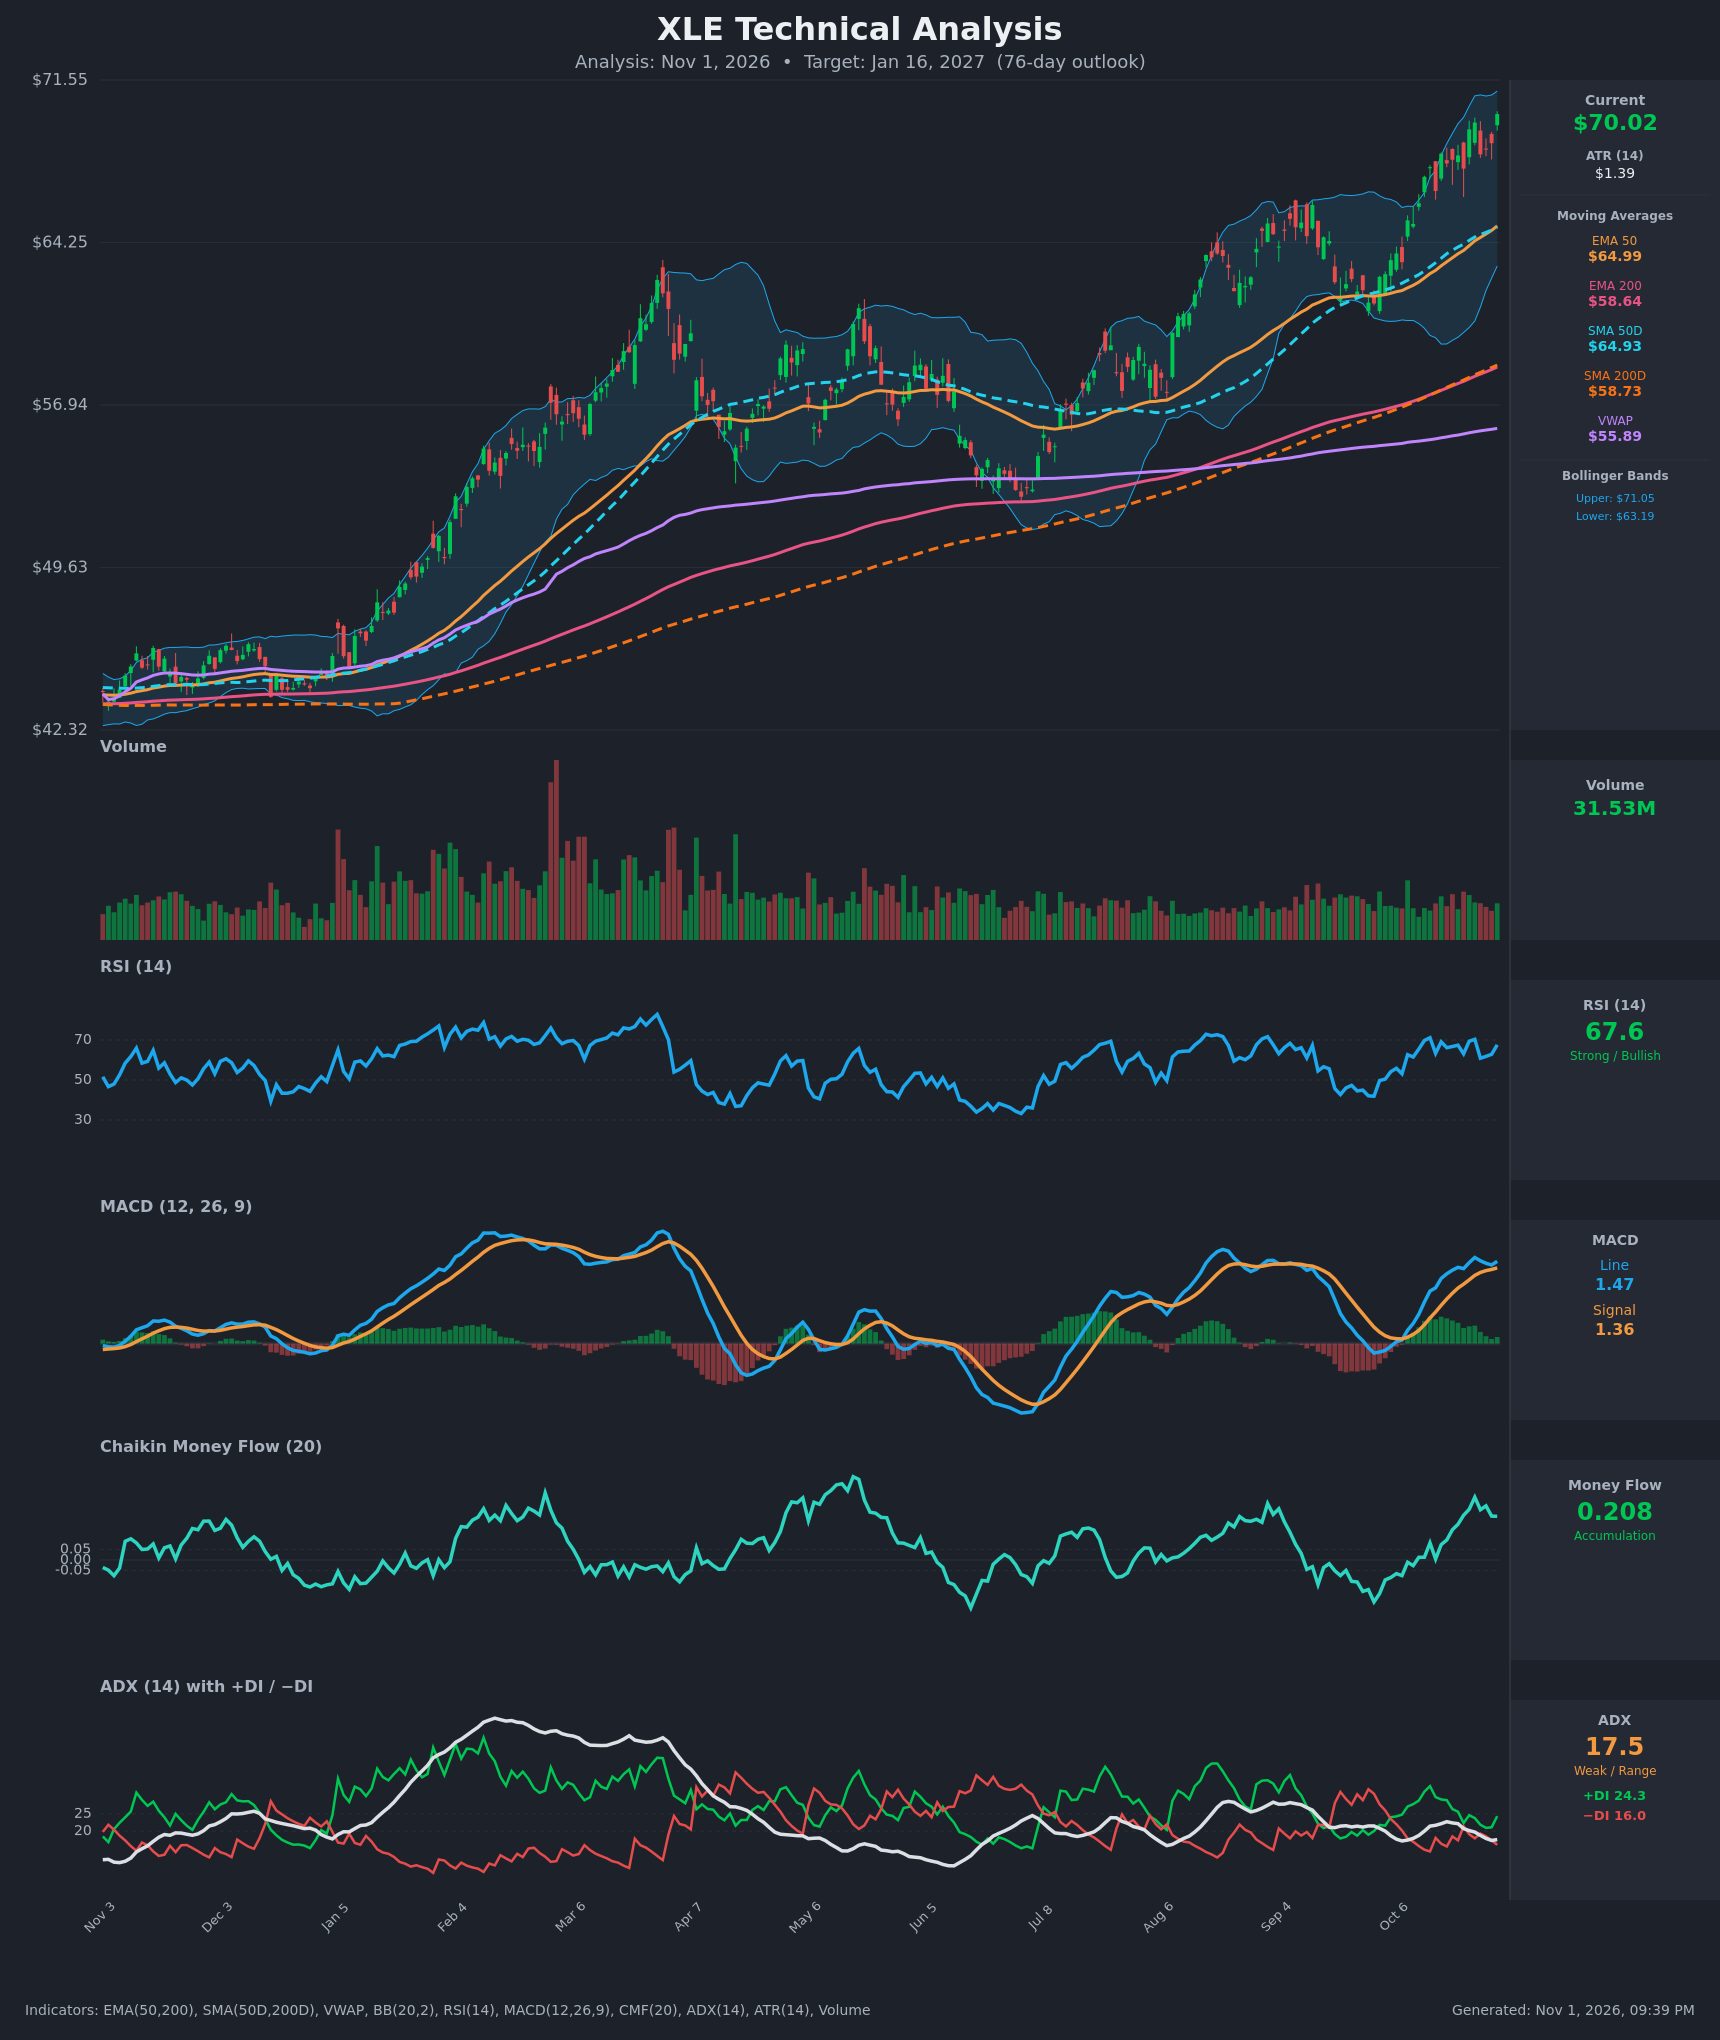
Analysis
TECHNICAL INDICATORS
- RSI (14): 67.58, just under the 70 overbought line. It has oscillated between 61 and 71 over the last 15 bars and is rebounding from 60.9 on Oct 27. Momentum is strong but near exhaustion territory. [Bullish]
- 20 EMA: The 20 EMA isn't given directly. EMA50 is $64.99 and price at $70.02 is about 7.7% above it, with EMA50 rising every day. Price is well above all short- and medium-term averages, which act as support. The extension also raises pullback risk. [Bullish]
- MACD: Line 1.473 above signal 1.357, so the histogram is positive (+0.12). The histogram has narrowed from a peak of about 0.28 on Oct 26 and ticked back up on the last bar. The line is still above zero. Momentum is positive but has lost some steam. [Bullish]
- Bollinger Bands (20): Upper $71.05, lower $63.19, so price sits in the upper quarter of the bands, about $1.03 below the upper band. It is riding the upper half in an orderly uptrend, not a blow-off. The bands are modestly wide. [Bullish]
- CMF (20): 0.208, well above +0.05, and it has been positive and rising from about 0.01 on Oct 12-13. This is sustained accumulation, and it confirms the price advance. [Accumulation]
- ADX (14): 17.5, below 20 and slipping from 22.7. +DI 24.3 is above −DI 16.0, so bulls lead directionally. The trend is not strong by ADX, partly because the advance has been grinding and choppy. [Weak Trend, bullish direction]
- Volume: 31.53M, roughly average with no climactic spike. Volume on the recent advance is steady and not expanding, which is a mild caution, though not a divergence. [Neutral to mildly supportive]
DIVERGENCES & TRENDS
- Moving averages: Price ($70.02) > EMA50 ($64.99) > SMA50D ($64.93) > EMA200 ($58.64) > SMA200D ($58.73) > VWAP ($55.89). This is a fully bullish stack. The golden cross is in place, and the 50-day averages and 200-day averages keep rising. The SMA200D has only recently converged with the EMA200.
- Higher highs: On the chart, price has made a succession of higher highs and higher lows since the Jun-Jul base near $52. The prior peak was about $63 in Mar, then about $66 in Sep, and now price has broken to about $70.
- Momentum: RSI is near but not above its earlier highs, and MACD is below its Sep peak while price is at new highs. This is a mild bearish divergence in MACD, but it is not decisive because the Oct MACD line is still rising.
- ADX: Weak ADX with rising prices shows the advance is steady and low-volatility. ADX could rise if the trend accelerates.
- Mean reversion: Price is about 7.7% above EMA50, and previous extensions to the upper band (Mar, Sep) were followed by pullbacks to the 50-day average zone.
- Crossovers: The MACD stays above its signal line, with no recent crossover. +DI and −DI converged on Oct 22 (22.3 vs 21.4) and then re-widened to bulls' favor.
CHART PATTERNS
- Ascending channel / higher-high staircase: The Jun-Oct advance shows a series of higher highs and higher lows, consistent with a continuation uptrend, like the Ascending Triangle or Bullish Flag family on the reference. The Sep-Oct consolidation around $66-$68 acted as a flag/base, and the break above it points to a measured move of roughly $4-$6 above the break, about $72-$74.
- Rising wedge risk: The last leg's narrowing momentum (MACD histogram fading, RSI capped near 70) is a minor warning of a Bearish Rising Wedge. This is not confirmed, and a close back below about $66 would raise its odds.
- No reversal pattern: There is no double top or head and shoulders yet. The chart shows a trend continuation with an extended price.
POTENTIAL SCENARIOS
- Scenario 1: Bullish Trend Continuation — Price holds above the 50-day averages, accumulation stays strong (CMF > 0.2), and the advance extends in a grinding uptrend with shallow pullbacks. Trigger: daily close above the $71.05 upper band and then above $72. Target: $74-$77. Invalidation: close below $65 (EMA50/SMA50D). (50% probability)
- Scenario 2: Bearish Pullback to the Mean — Overbought RSI, fading MACD histogram, and the 7.7% extension over the EMA50 prompt a retracement, consistent with prior upper-band rejections. Trigger: close below $66.5 with MACD crossing below signal. Target: $63-$65, the EMA50/SMA50D zone. Invalidation: reclaim of $70 on volume. (25% probability)
- Scenario 3: Neutral Consolidation — With ADX below 20, price oscillates between $65 and $71 as moving averages catch up. Trigger: repeated failures at $71 and holds at $66. Target: $66-$71. Invalidation: close above $72 or below $64. (25% probability)
PRICE TARGETS
For a 76-day horizon, the range width should be ~18-30% of current price. I use about 22%, or $15.40 on a $70.02 price (width = $77.00 - $61.60 = $15.40, 22%).
- Target Price: $72.50 (76 days)
- Expected Range: $61.60 to $77.00
- Key Levels: Support at $64.99, Resistance at $71.05
OVERALL BIAS
OVERALL BIAS: BULLISH - The stack of rising moving averages (golden cross intact), sustained CMF accumulation (0.208), positive MACD, and +DI above −DI favor further upside. The target is only modestly above the current price because of overbought RSI, weak ADX, and a 7.7% extension above the EMA50, which raise the risk of a mean-reversion pullback along the way.
This is educational analysis and not financial advice.