BB 97-day bullish forecast — Nov 1, 2026
- Bias: Bullish
- Timeframe: 97 days (made Nov 1, 2026, target date Feb 5, 2027)
- Price at analysis: $8.42
- Price target: $8.95
- Expected range: $7.60 – $9.85
- Result: Pending — graded after the close on Feb 5, 2027
Get a free AI analysis of BB today
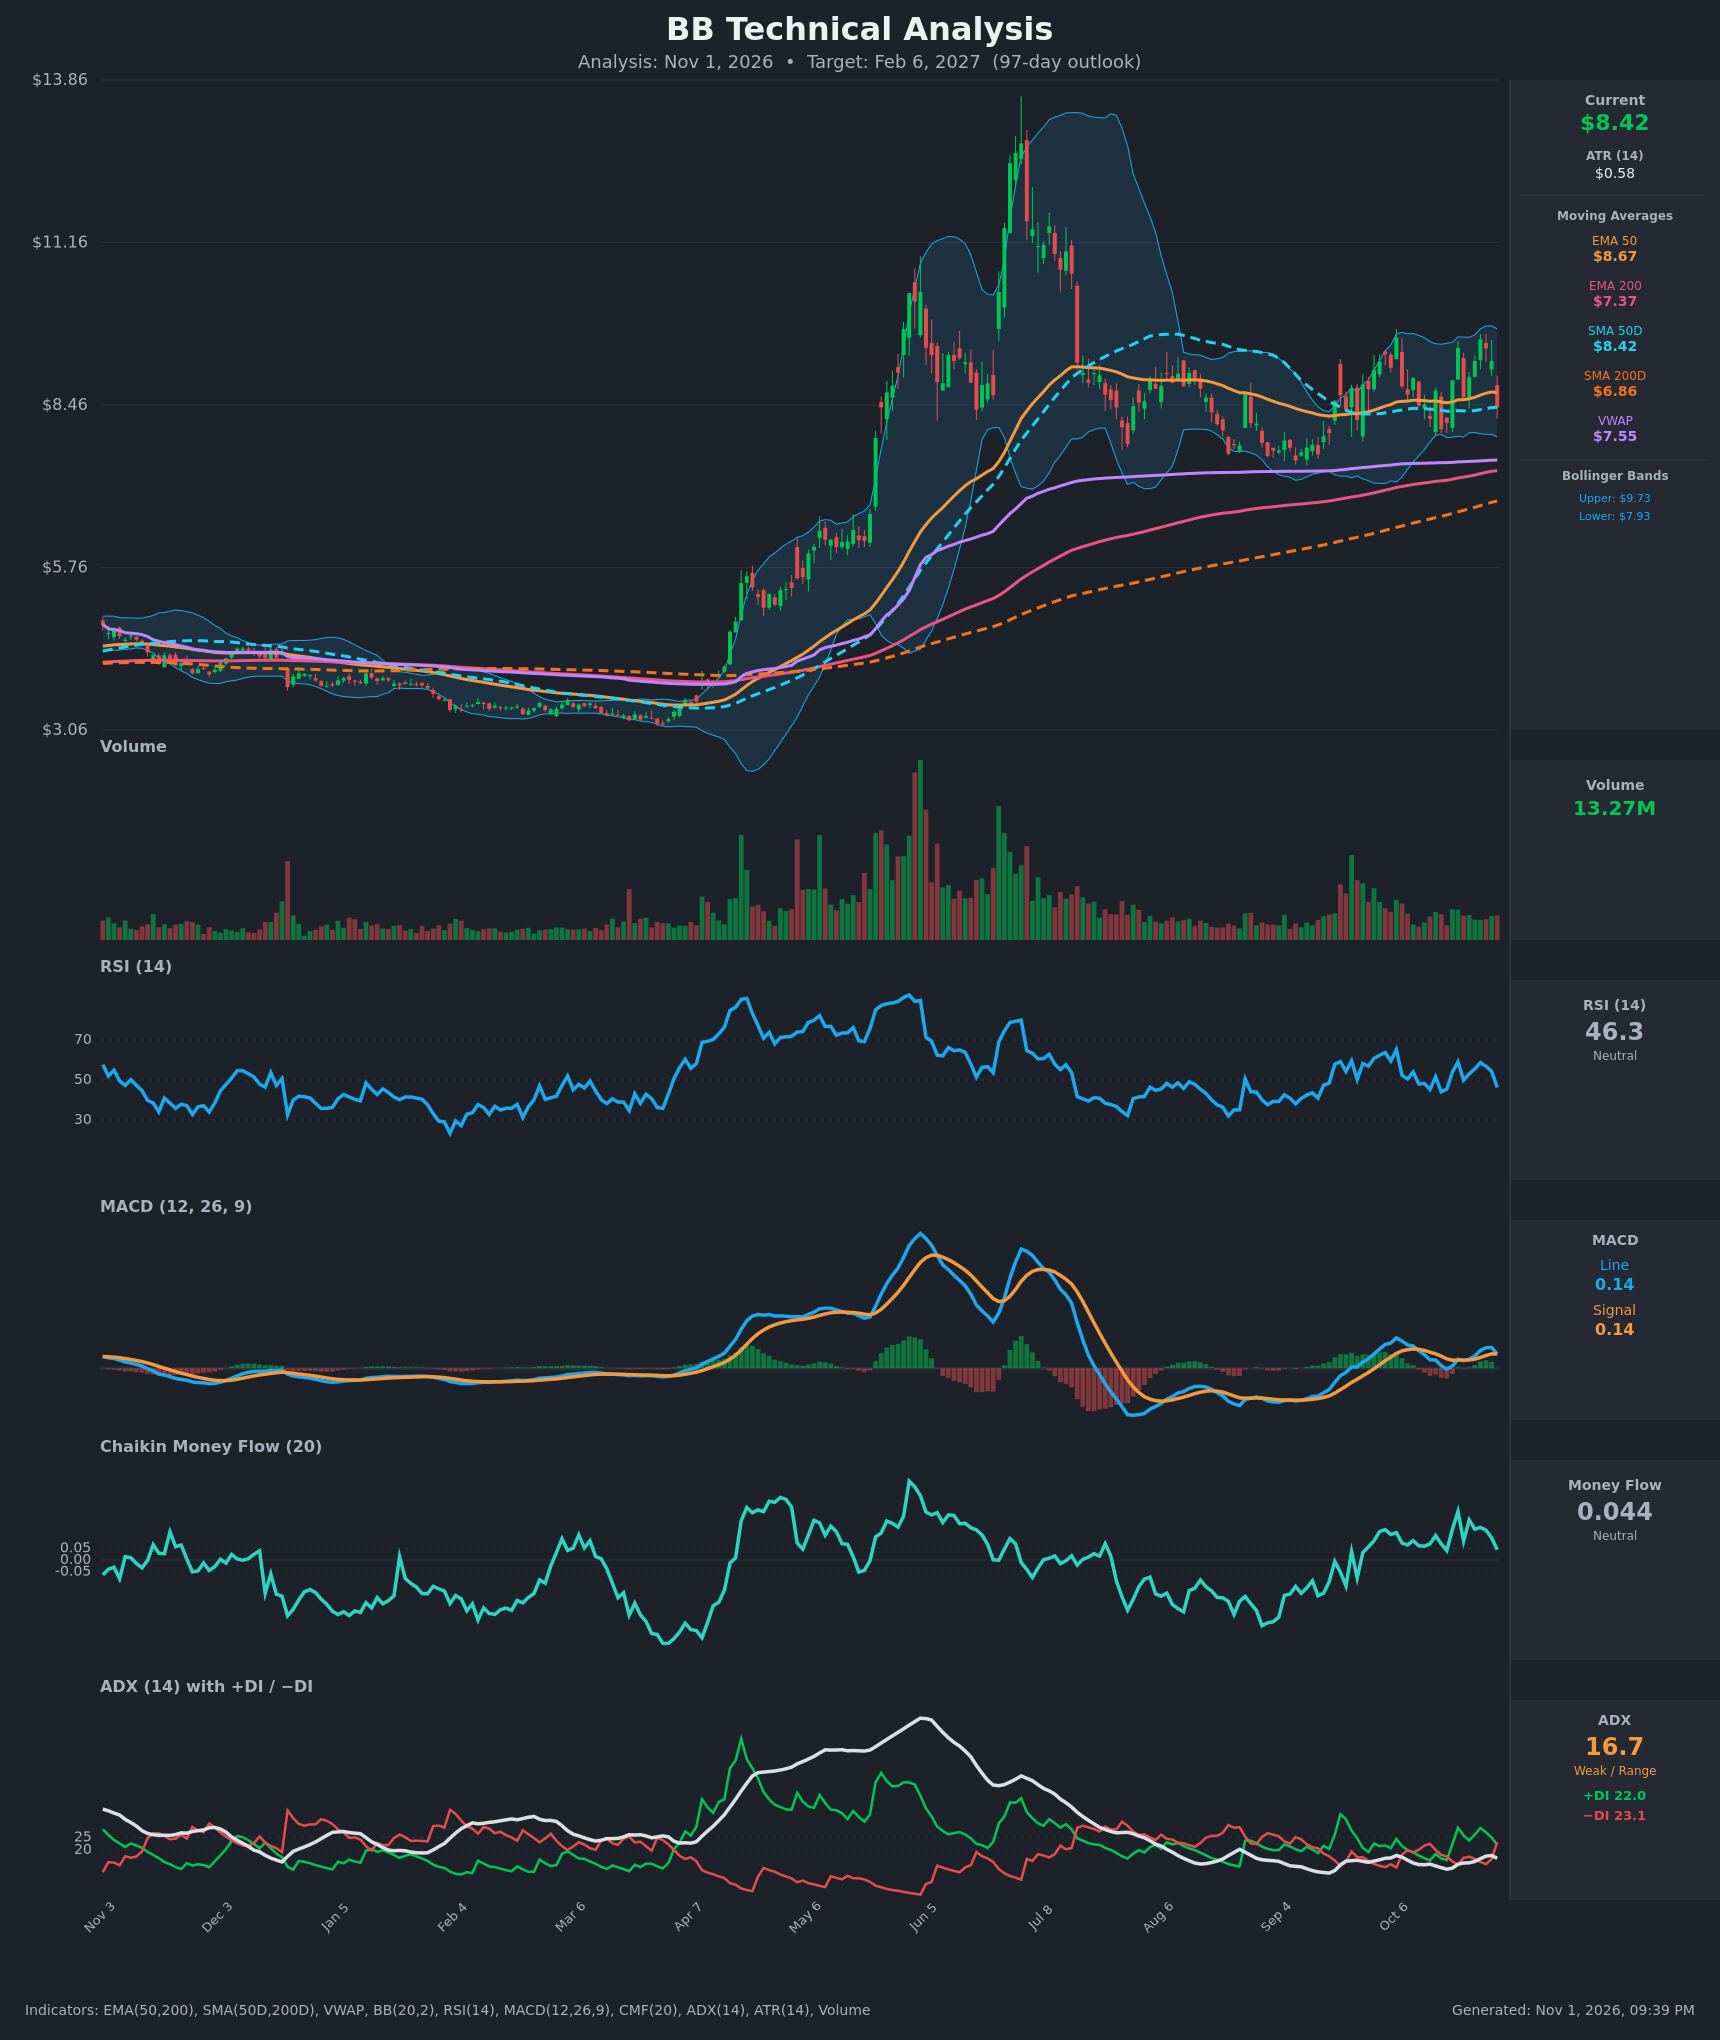
Analysis
TECHNICAL INDICATORS
- RSI (14): 46.29, down sharply from 58.7 on Oct 27 and now below the 50 midline. Momentum is fading in the short term, but it is nowhere near oversold. In recent months RSI has bounced from the 35-45 zone. [Neutral]
- 20 EMA: Not supplied. Price at $8.42 sits just below the EMA 50 ($8.67), which is acting as near-term resistance after the Oct 30 drop. It is exactly on the SMA 50D ($8.42) and well above the EMA 200 ($7.37). [Neutral]
- MACD: Line 0.1369 vs signal 0.1373, so the line is essentially touching the signal and a bearish crossover is forming. The line has rolled over from 0.199, so the histogram has flipped to roughly zero or slightly negative. Both lines are barely positive, so the signal is weak. [Bearish]
- Bollinger Bands (20): Upper $9.73, lower $7.93, mid-band about $8.83. Price fell from the upper half to below the mid-line. The bands are moderately wide after the Oct rally and have room to move either way. A reversion toward the lower band at $7.93 is possible, but there is no squeeze or breakout. [Neutral]
- CMF (20): 0.044, between ±0.05 and falling from 0.207 on Oct 21. Buying pressure has faded, though it has not turned into distribution. [Neutral]
- ADX (14): 16.7 with −DI (23.1) above +DI (22.0). The trend is weak and range-bound. The fresh bearish DI cross follows the Oct 21-29 bullish stretch, but ADX is too low to confirm any trend. [Weak Trend, slight bearish tilt]
- Volume: 13.27M, moderate and not elevated on the sharp Oct 30 drop (-8.4%). That suggests profit-taking rather than heavy distribution. Volume is far below the April-July spikes. [Neutral / mild pullback]
Moving-average structure:
- SMA 50D ($8.42) is well above SMA 200D ($6.86), and EMA 50 ($8.67) is above EMA 200 ($7.37). Both golden crosses are in place.
- Price is above SMA 200D, EMA 200 and VWAP ($7.55). The long-term uptrend is intact.
- All the long-term averages are rising, which acts as a rising floor.
DIVERGENCES & TRENDS
- There is no major price/RSI divergence. Price made a higher high at $9.55 on Oct 27 while RSI peaked at 58.7, below its earlier readings. That is a minor sign of reduced momentum on the bounce.
- MACD is flattening and about to cross down while price pulls back to the SMA 50D. This is a short-term bearish crossover inside a longer-term base.
- The ADX has stayed under 20 for roughly three months, which is consistent with consolidation after the spike to about $13 and the retracement.
- The lows are rising: about $7.3 in Sep, then $8.06 on Oct 16. The Oct 27 high of $9.55 was also higher than the prior swing highs near $9.2 and $9.4.
- The −DI crossover on the last bar confirms the one-day rejection. It needs follow-through to matter.
CHART PATTERNS
- Consolidation range after a parabolic spike: Price has traded between roughly $7.3 and $9.6 since August, below the $13 peak. This resembles a large Symmetrical / Ascending Triangle with higher lows into a roughly flat $9.4-$9.6 resistance. The reference continuation pattern breaks upward in an uptrend.
- A break above $9.55 would project the triangle height (about $2.0-$2.2) to roughly $11.5. That is a longer-dated, more optimistic target than the 97-day base case.
- The Bearish Double Top variant is a risk. The $9.4 (Oct 21) and $9.55 (Oct 27) highs form a possible double top. A loss of $8.06 would project toward about $7.3 (the SMA 200D / EMA 200 zone).
- Overall, the pattern is a constructive base with an unresolved breakout.
POTENTIAL SCENARIOS
- Scenario 1: Bullish Range Breakout Attempt — The golden-cross structure and rising 200-day averages hold the higher-low sequence. Price holds above $8.06 and retakes the EMA 50 and the $9.0-$9.5 area over the following months. Trigger: a daily close above $8.67 followed by a break above $9.55. Target: $9.50-$9.85, with an extension toward $11 on a clean breakout. Invalidation: a daily close below $7.90 (the lower Bollinger band and the Oct low area). (45% probability)
- Scenario 2: Neutral Range Chop — ADX stays below 20 and price oscillates between about $7.6 and $9.5, ending near the middle. Trigger: repeated failures at $9.5 and buyers stepping in near $8.0. Target: $8.40-$8.90. Invalidation: a close above $9.60 or below $7.60. (25% probability)
- Scenario 3: Bearish Double-Top Breakdown — The MACD cross and −DI dominance lead to a loss of $8.06 and a retest of the long-term averages. Trigger: a close below $8.06, then $7.93. Target: $7.35-$7.55 (EMA 200 and VWAP). Invalidation: a reclaim of $8.67 on rising volume. (30% probability)
PRICE TARGETS
For the 97-day horizon (to about Feb 6, 2027):
- Target Price: $8.95
- Expected Range: $7.60 to $9.85 (width $2.25, about 26.7% of the current price, consistent with the 18-30% guidance for 61-180 days)
- Key Levels: Support at $8.06 (Oct 16 swing low; $7.93 lower band and $7.37 EMA 200 below), Resistance at $8.67 (EMA 50; then $9.55 recent high)
OVERALL BIAS
OVERALL BIAS: BULLISH - Price is above all the long-term averages (SMA 200D, EMA 200 and VWAP) after golden crosses, and the rising higher lows favour an eventual upside resolution of the $7.3-$9.6 range. Near-term caution is warranted by the MACD cross, the −DI cross and the break below the EMA 50, so expect modest rather than strong gains.
This is educational analysis and not financial advice.