BAC 97-day bullish forecast — Nov 1, 2026
- Bias: Bullish
- Timeframe: 97 days (made Nov 1, 2026, target date Feb 5, 2027)
- Price at analysis: $50.01
- Price target: $53.20
- Expected range: $45.50 – $57.50
- Result: Pending — graded after the close on Feb 5, 2027
Get a free AI analysis of BAC today
Analysis
TECHNICAL INDICATORS
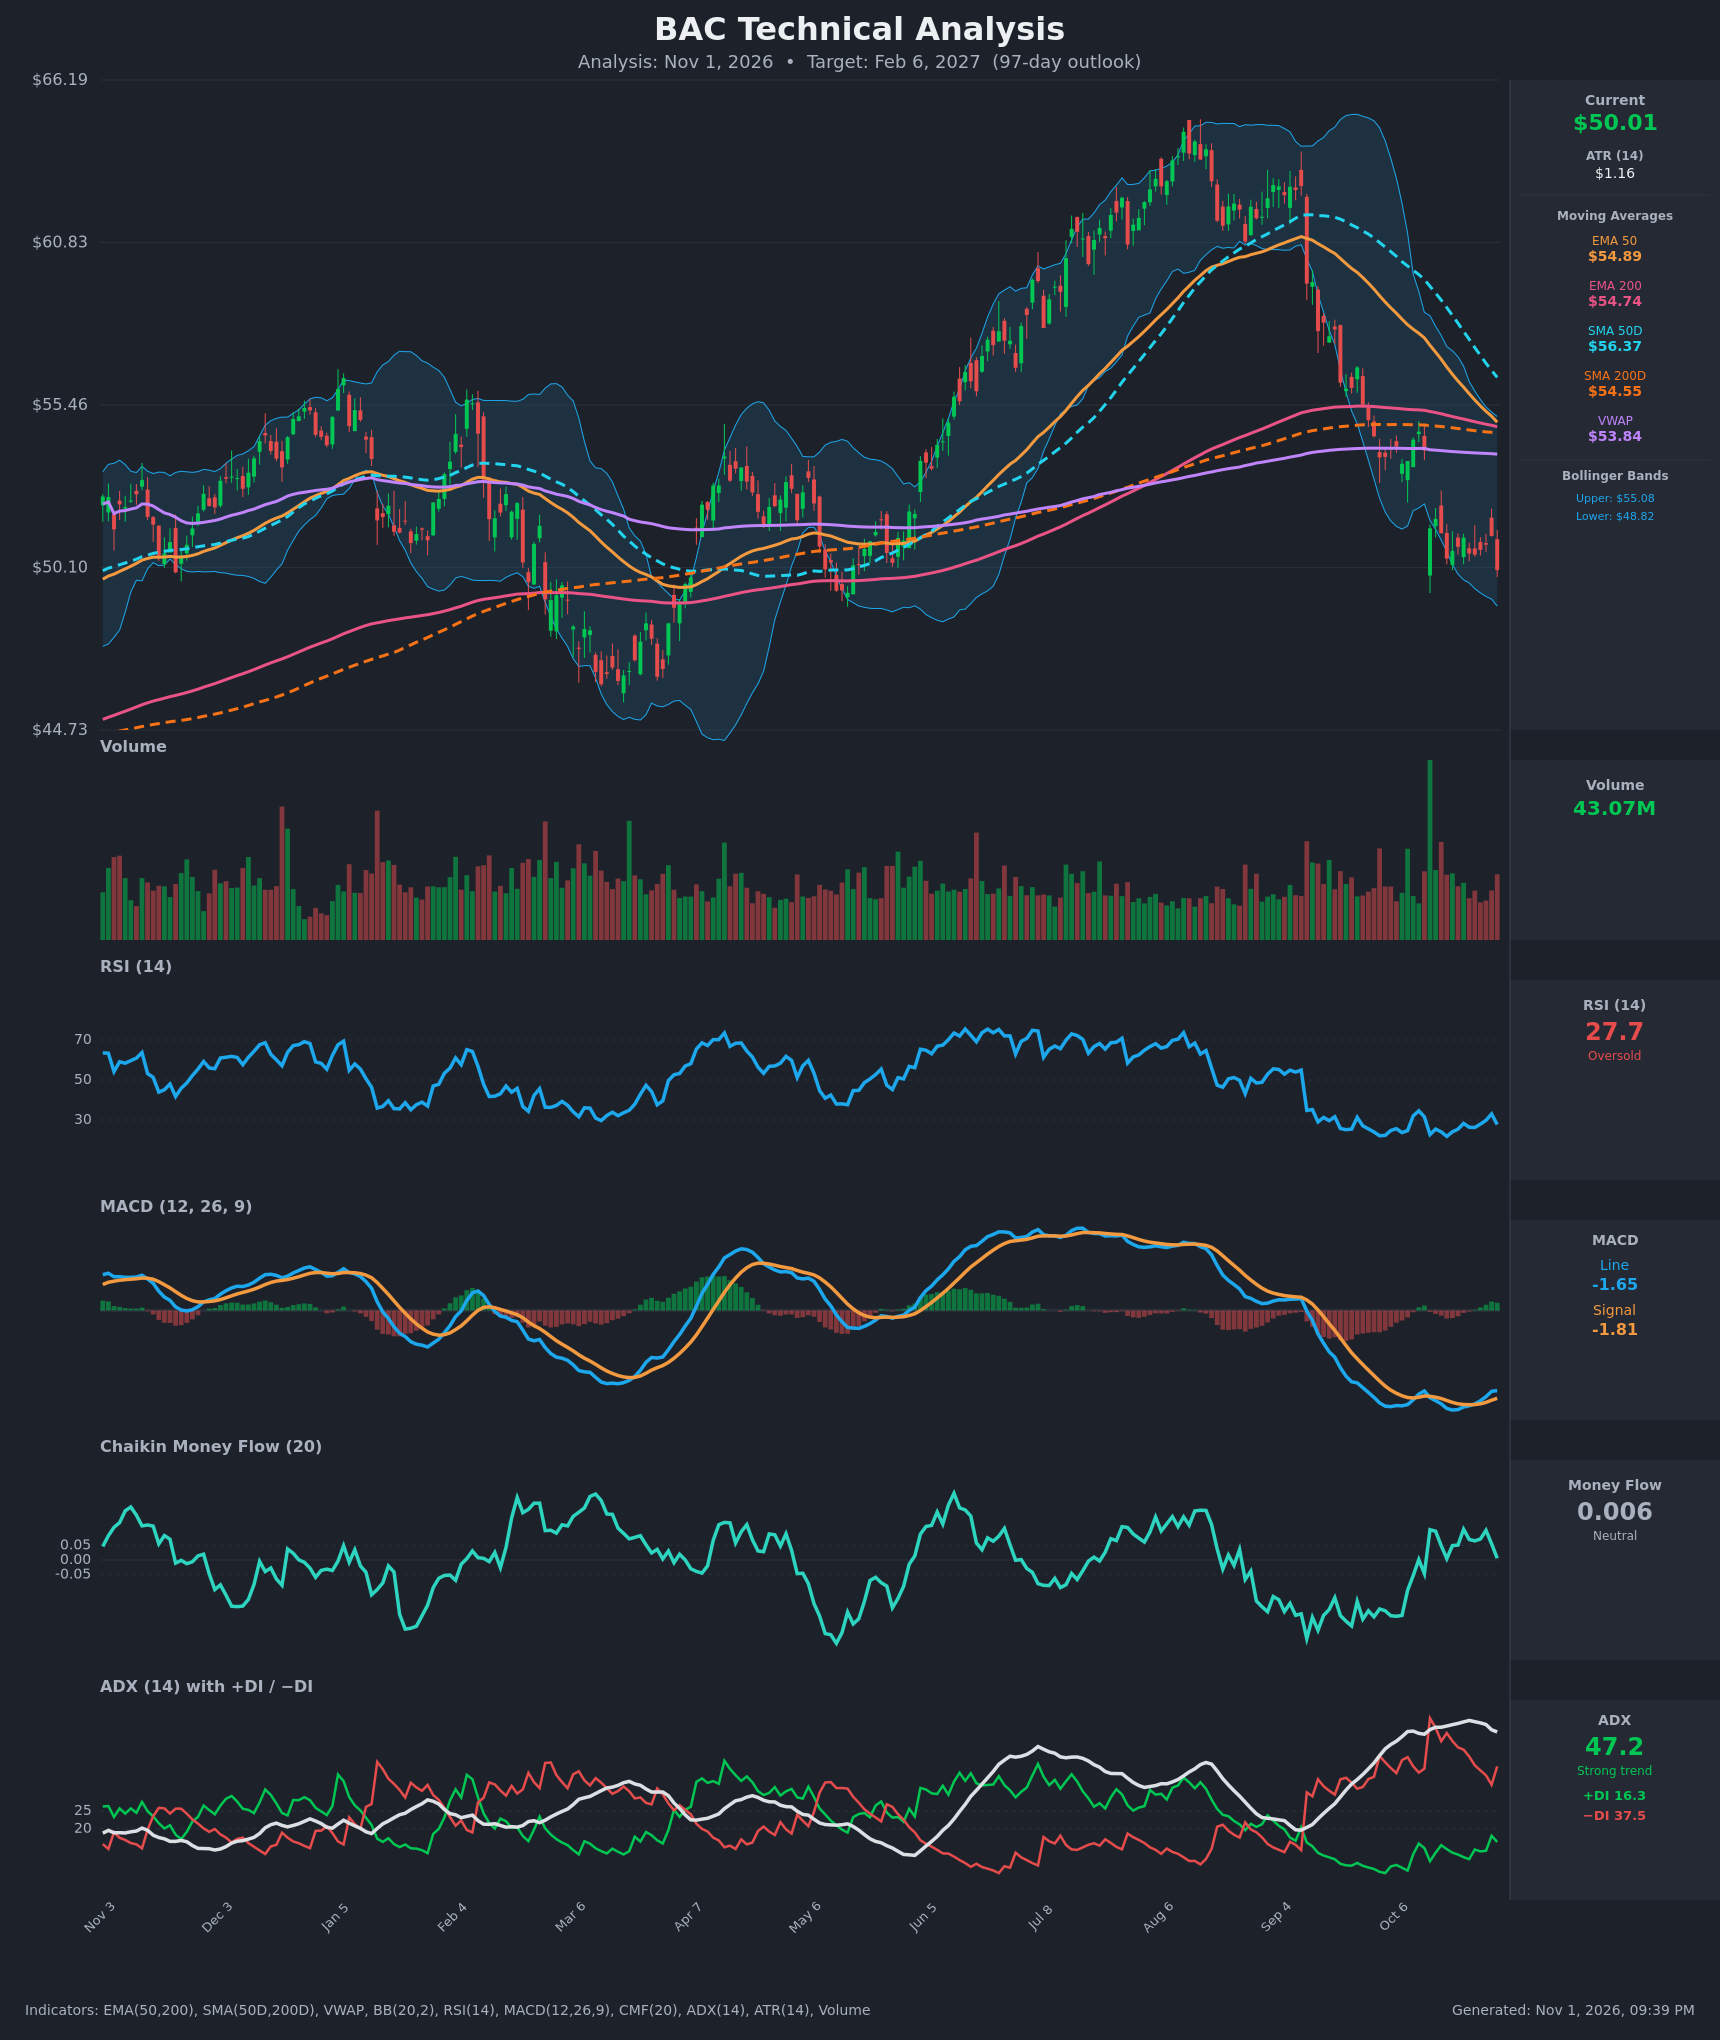
- RSI (14): 27.73, oversold. It made a washed-out low of 21.8 on Oct 19 and has since chopped between 24 and 33. The latest drop from 33.0 to 27.7 shows momentum is still weak, but the higher low versus Oct 19 is a mild stabilization sign. [Neutral]
- 20 EMA: No 20 EMA value was supplied, so I use the EMA 50 at $54.89 as the nearest proxy. Price at $50.01 is about 9% below it, and the EMA is still falling about $0.20 per day. It is overhead resistance. [Bearish]
- MACD: The line (-1.649) has crossed above the signal (-1.807), so the histogram is slightly positive at about +0.16. This is a bullish crossover, but deep below zero, so it is only an early momentum-stabilization signal, not a trend reversal. [Bullish]
- Bollinger Bands (20): Upper $55.08, lower $48.82, with price at $50.01 in the lower quarter of the bands. The bands have widened after the Sep selloff. Price rode the lower band for weeks without a fresh breakdown, which points to selling exhaustion rather than acceleration. [Neutral]
- CMF (20): 0.006, inside the ±0.05 neutral zone. It has hovered between 0 and 0.10 through the decline, so there is no clear distribution. Weak buying pressure on the base is a quiet positive but not a confirmation. [Neutral]
- ADX (14): 47.2 with -DI at 37.5 and +DI at 16.3. This is a strong, mature downtrend with bears firmly on top. ADX peaked near 50.4 on Oct 23 and has started to roll over (47.2), and -DI has come down from its 51.1 spike. This often signals downside momentum fading. [Strong Trend – Bearish, possibly maturing]
- Volume: 43.07M, with a big capitulation-style spike in early Oct and lighter volume during the recent sideways drift near $50–51. The decline is no longer being accompanied by expanding volume, which is consistent with a basing attempt. [Neutral/Mildly Bullish – selling pressure fading]
DIVERGENCES & TRENDS
- Moving averages: Price is below EMA 50, EMA 200, SMA 50D, SMA 200D and VWAP ($53.84), so the trend is clearly down. EMA 50 ($54.89) is converging on EMA 200 ($54.74) and is about to cross bearish. SMA 50D ($56.37) is falling toward SMA 200D ($54.55), so a death cross is likely within weeks. These are lagging confirmations of a move that has already happened.
- MACD vs. price: On Oct 19 the MACD was -2.02 with price at $50.39. Now MACD is -1.65 with price at $50.01, a lower price and a higher MACD. That is a mild bullish divergence.
- RSI vs. price: RSI printed 21.8 on Oct 19 and 27.7 now, at similar price levels. This is another mild bullish divergence.
- ADX/DI: ADX is rolling over from 50 and -DI is off its peak. This suggests trend exhaustion, but there is no DI crossover, so bears remain in control.
- Price structure: Price has held a $50–51.5 range for about two weeks after a sharp drop from $60. That is a consolidation, and so far there is no confirmed higher low.
CHART PATTERNS
- Broad structure: The June–August advance to about $64, followed by a failed retest and a sharp breakdown, resembles a Bearish Double Top / rounded distribution. The breakdown through the $55 neckline has already played out. The full measured move lands around $46–47.
- Recent consolidation: The tight range at $50–51.5 after the Sept–Oct drop resembles a Bearish Flag/Pennant. A break below $49.50 would project a measured move toward about $45–46.
- Counter-pattern: The oversold bounce attempts, with MACD and RSI divergences, could develop into a Bullish Double Bottom with a potential neckline near $51.50–$52. That is not yet confirmed.
- Longer-term support: The $48.80–$49.50 zone held in May and again near the lower Bollinger Band. The March low near $46 is the deeper support.
POTENTIAL SCENARIOS
- Scenario 1: Bullish Oversold Mean-Reversion Rally — Deeply oversold RSI, a MACD bullish cross, mild bullish divergences, a rolling-over ADX and fading volume favor a relief rally back toward the VWAP and the EMA/SMA 200 cluster over 97 days. Trigger: close above $51.60 (top of the recent range), then above $52.50. Target: $53.20 to $54.70 (VWAP, then the EMA/SMA 200 cluster). Invalidation: daily close below $48.50. (45% probability)
- Scenario 2: Bearish Trend Continuation — The bearish flag resolves lower as the death cross confirms and -DI stays dominant. Trigger: close below $49.30 on rising volume. Target: $46.00 to $45.50 (March low and the flag measured move). Invalidation: close above $52.50. (40% probability)
- Scenario 3: Neutral Range Consolidation — Price chops between roughly $48.50 and $53 as the oversold condition unwinds slowly. Trigger: failure to break either $49.30 or $51.60. Target: $50–$52. Invalidation: a decisive close outside the $48.50–$53 range. (15% probability)
PRICE TARGETS
- Target Price: $53.20 (97 days, Feb 6, 2027)
- Expected Range: $45.50 to $57.50. The width is $12.00, or about 24% of the current price, in line with the 61–180 day guidance.
- Key Levels: Support at $48.80 (lower Bollinger Band and May lows), Resistance at $53.84 (VWAP, followed by the $54.55–$54.89 moving-average cluster)
OVERALL BIAS
OVERALL BIAS: BULLISH – Deeply oversold RSI, a MACD bullish crossover, mild bullish divergences and a rolling-over ADX with fading selling volume favor a mean-reversion rally toward $53–54 within 97 days. Conviction is modest, because the trend is still firmly down and a break of $49.30 would open $45–46.
This is educational analysis and not financial advice.