KWEB 97-day bearish forecast — Nov 1, 2026
- Bias: Bearish
- Timeframe: 97 days (made Nov 1, 2026, target date Feb 5, 2027)
- Price at analysis: $22.74
- Price target: $21.60
- Expected range: $18.80 – $25.40
- Result: Pending — graded after the close on Feb 5, 2027
Get a free AI analysis of KWEB today
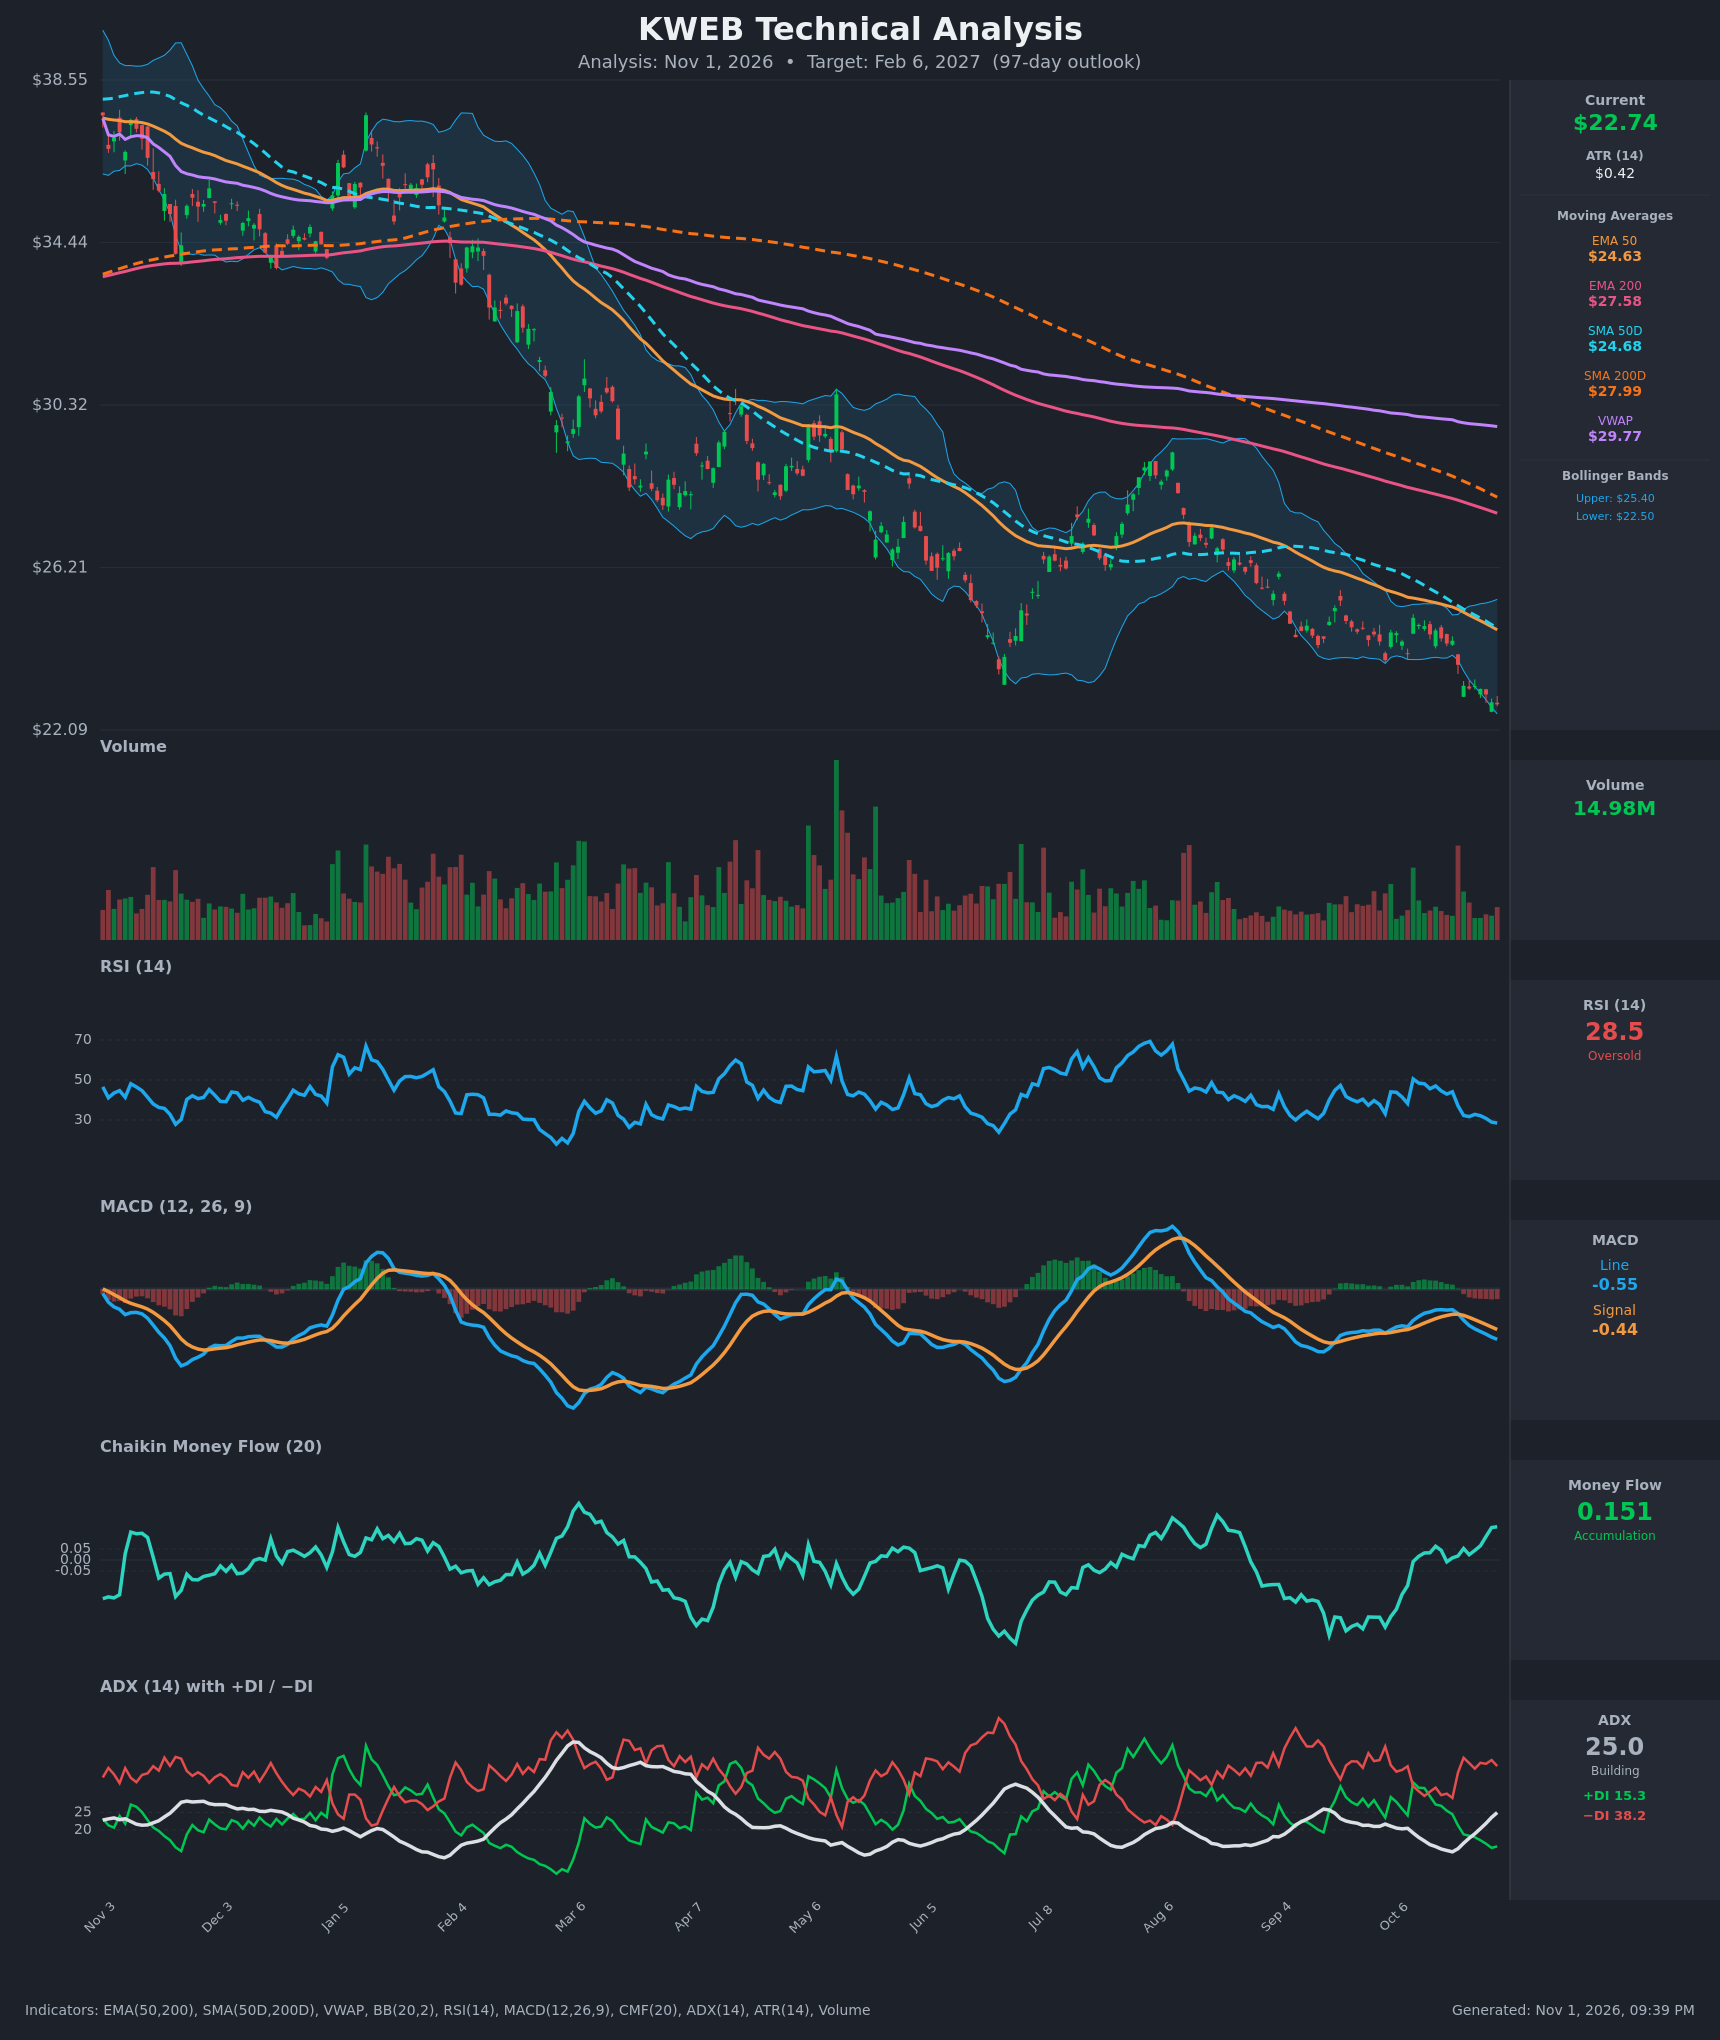
Analysis
TECHNICAL INDICATORS
- RSI (14): 28.48, in oversold territory and falling from the mid-40s in mid-October. Momentum is still pointing down, with no bullish divergence yet. The prior oversold readings (Mar, Jun) were followed by bounces. [Bearish]
- 20 EMA: Not given directly. The EMA 50 ($24.63) and SMA 50D ($24.68) sit about 8% above price, and the shorter-term average is clearly above price and acting as resistance. [Bearish]
- MACD: Line -0.55 is below signal -0.44 and the gap is widening. The histogram is negative and expanding, and the bearish crossover happened around Oct 21-22. [Bearish]
- Bollinger Bands (20): Upper $25.40, lower $22.50. Price at $22.74 is hugging the lower band and walking it, which signals strong downside momentum. It is also a stretched condition that could allow a relief bounce toward the midline (~$23.9-24.0). [Bearish]
- CMF (20): +0.151, well above the +0.05 threshold and rising since mid-October. Buying pressure is building even as price falls, which is a bullish divergence. [Accumulation]
- ADX (14): 25.0 and rising from about 14 in mid-October. −DI at 38.2 is far above +DI at 15.3, so bears are firmly in control and the downtrend is gaining strength. [Strong Trend - Bearish]
- Volume: 14.98M, roughly average to slightly below average. The breakdown below $23 has not come with a capitulation spike. Selling is orderly, with no climactic washout to mark a bottom. [Neutral/Mildly Bearish]
DIVERGENCES & TRENDS
- Bullish divergence (price vs CMF): Price made new lows (~$22.74) while CMF climbed to +0.151, a multi-month high. This points to accumulation under the surface and is the main counter-trend signal.
- No RSI divergence: RSI is making lower lows in step with price, so momentum confirms the decline.
- Moving average structure: Price is below all of the EMA 50 ($24.63), SMA 50D ($24.68), EMA 200 ($27.58), SMA 200D ($27.99) and VWAP ($29.77). The 50s are below the 200s, so the death cross is already in place and the averages are all sloping down.
- MACD: The bearish crossover from late October is widening and the line is back below zero.
- ADX/DI: −DI has dominated since Oct 21 and ADX is rising through 25, which confirms a trend that is strengthening rather than exhausting.
- Long-term trend: The chart shows a persistent series of lower highs and lower lows from ~$38 down to ~$22.7. The Aug rally failed at the 50-day averages, and the move since has been a steady fade.
CHART PATTERNS
- Primary pattern: a long Bearish Rising Wedge / downtrend channel. The Jul-Aug rally to ~$28 was a corrective bounce inside a larger downtrend. It was rejected at the declining 50-day averages and gave way to a lower-high sequence.
- Continuation structure: Since the August peak, price has formed lower highs and lower lows below the falling 50-day averages. This resembles a bearish continuation (descending-channel-type) pattern. The break below the Sep-Oct support near $23.1-23.2 completed that leg.
- Targets: The measured move of the Aug-Oct decline (about $28 down to $23) projects toward $20.5-21.0. Counter-trend rallies should stall around $24.6-25.4, where the 50-day averages and the upper Bollinger Band sit.
- Reversal watch: The CMF divergence and oversold RSI could eventually form a base (double bottom or falling wedge), but no such pattern is confirmed yet.
POTENTIAL SCENARIOS
- Scenario 1: Bearish Trend Continuation — The downtrend persists with −DI dominant, ADX rising and price below every major average. Rallies fade at the 50-day averages. Trigger: Daily close below $22.40 (the lower band and the recent low). Target: $20.00-$21.00. Invalidation: Daily close above $25.40 (upper band and 50-day averages). (50% probability)
- Scenario 2: Neutral/Choppy Base Then Relief Bounce — Oversold RSI and CMF accumulation produce a bounce to the BB midline and the 50-day averages around $24-24.7, then price stalls and ranges. Trigger: RSI turns up through 35 with a close above $23.50. Target: $24.00-$24.70. Invalidation: Close below $22.00. (30% probability)
- Scenario 3: Bullish Reversal — CMF accumulation proves right, price reclaims the 50-day averages and a larger recovery runs toward the 200-day averages. Trigger: Close above $25.40 with a MACD bullish crossover. Target: $26.50-$27.50. Invalidation: Close back below $23.50. (20% probability)
PRICE TARGETS
- Target Price: $21.60 (97-day horizon, Feb 6, 2027)
- Expected Range: $18.80 to $25.40 (width $6.60, about 29% of current price, in line with the 61-180 day guidance of 18-30%)
- Key Levels: Support at $22.00, Resistance at $24.65
OVERALL BIAS
OVERALL BIAS: BEARISH - Price is below all major moving averages with a death cross in place. MACD is bearish, −DI (38.2) dominates +DI (15.3) with ADX rising through 25, and price is walking the lower Bollinger Band. The CMF accumulation divergence and oversold RSI argue for relief bounces, but they are not enough to overturn the trend.
This is educational analysis and not financial advice.