IWM 97-day bullish forecast — Nov 1, 2026
- Bias: Bullish
- Timeframe: 97 days (made Nov 1, 2026, target date Feb 5, 2027)
- Price at analysis: $279.33
- Price target: $291.00
- Expected range: $258.00 – $313.00
- Result: Pending — graded after the close on Feb 5, 2027
Get a free AI analysis of IWM today
Analysis
TECHNICAL INDICATORS
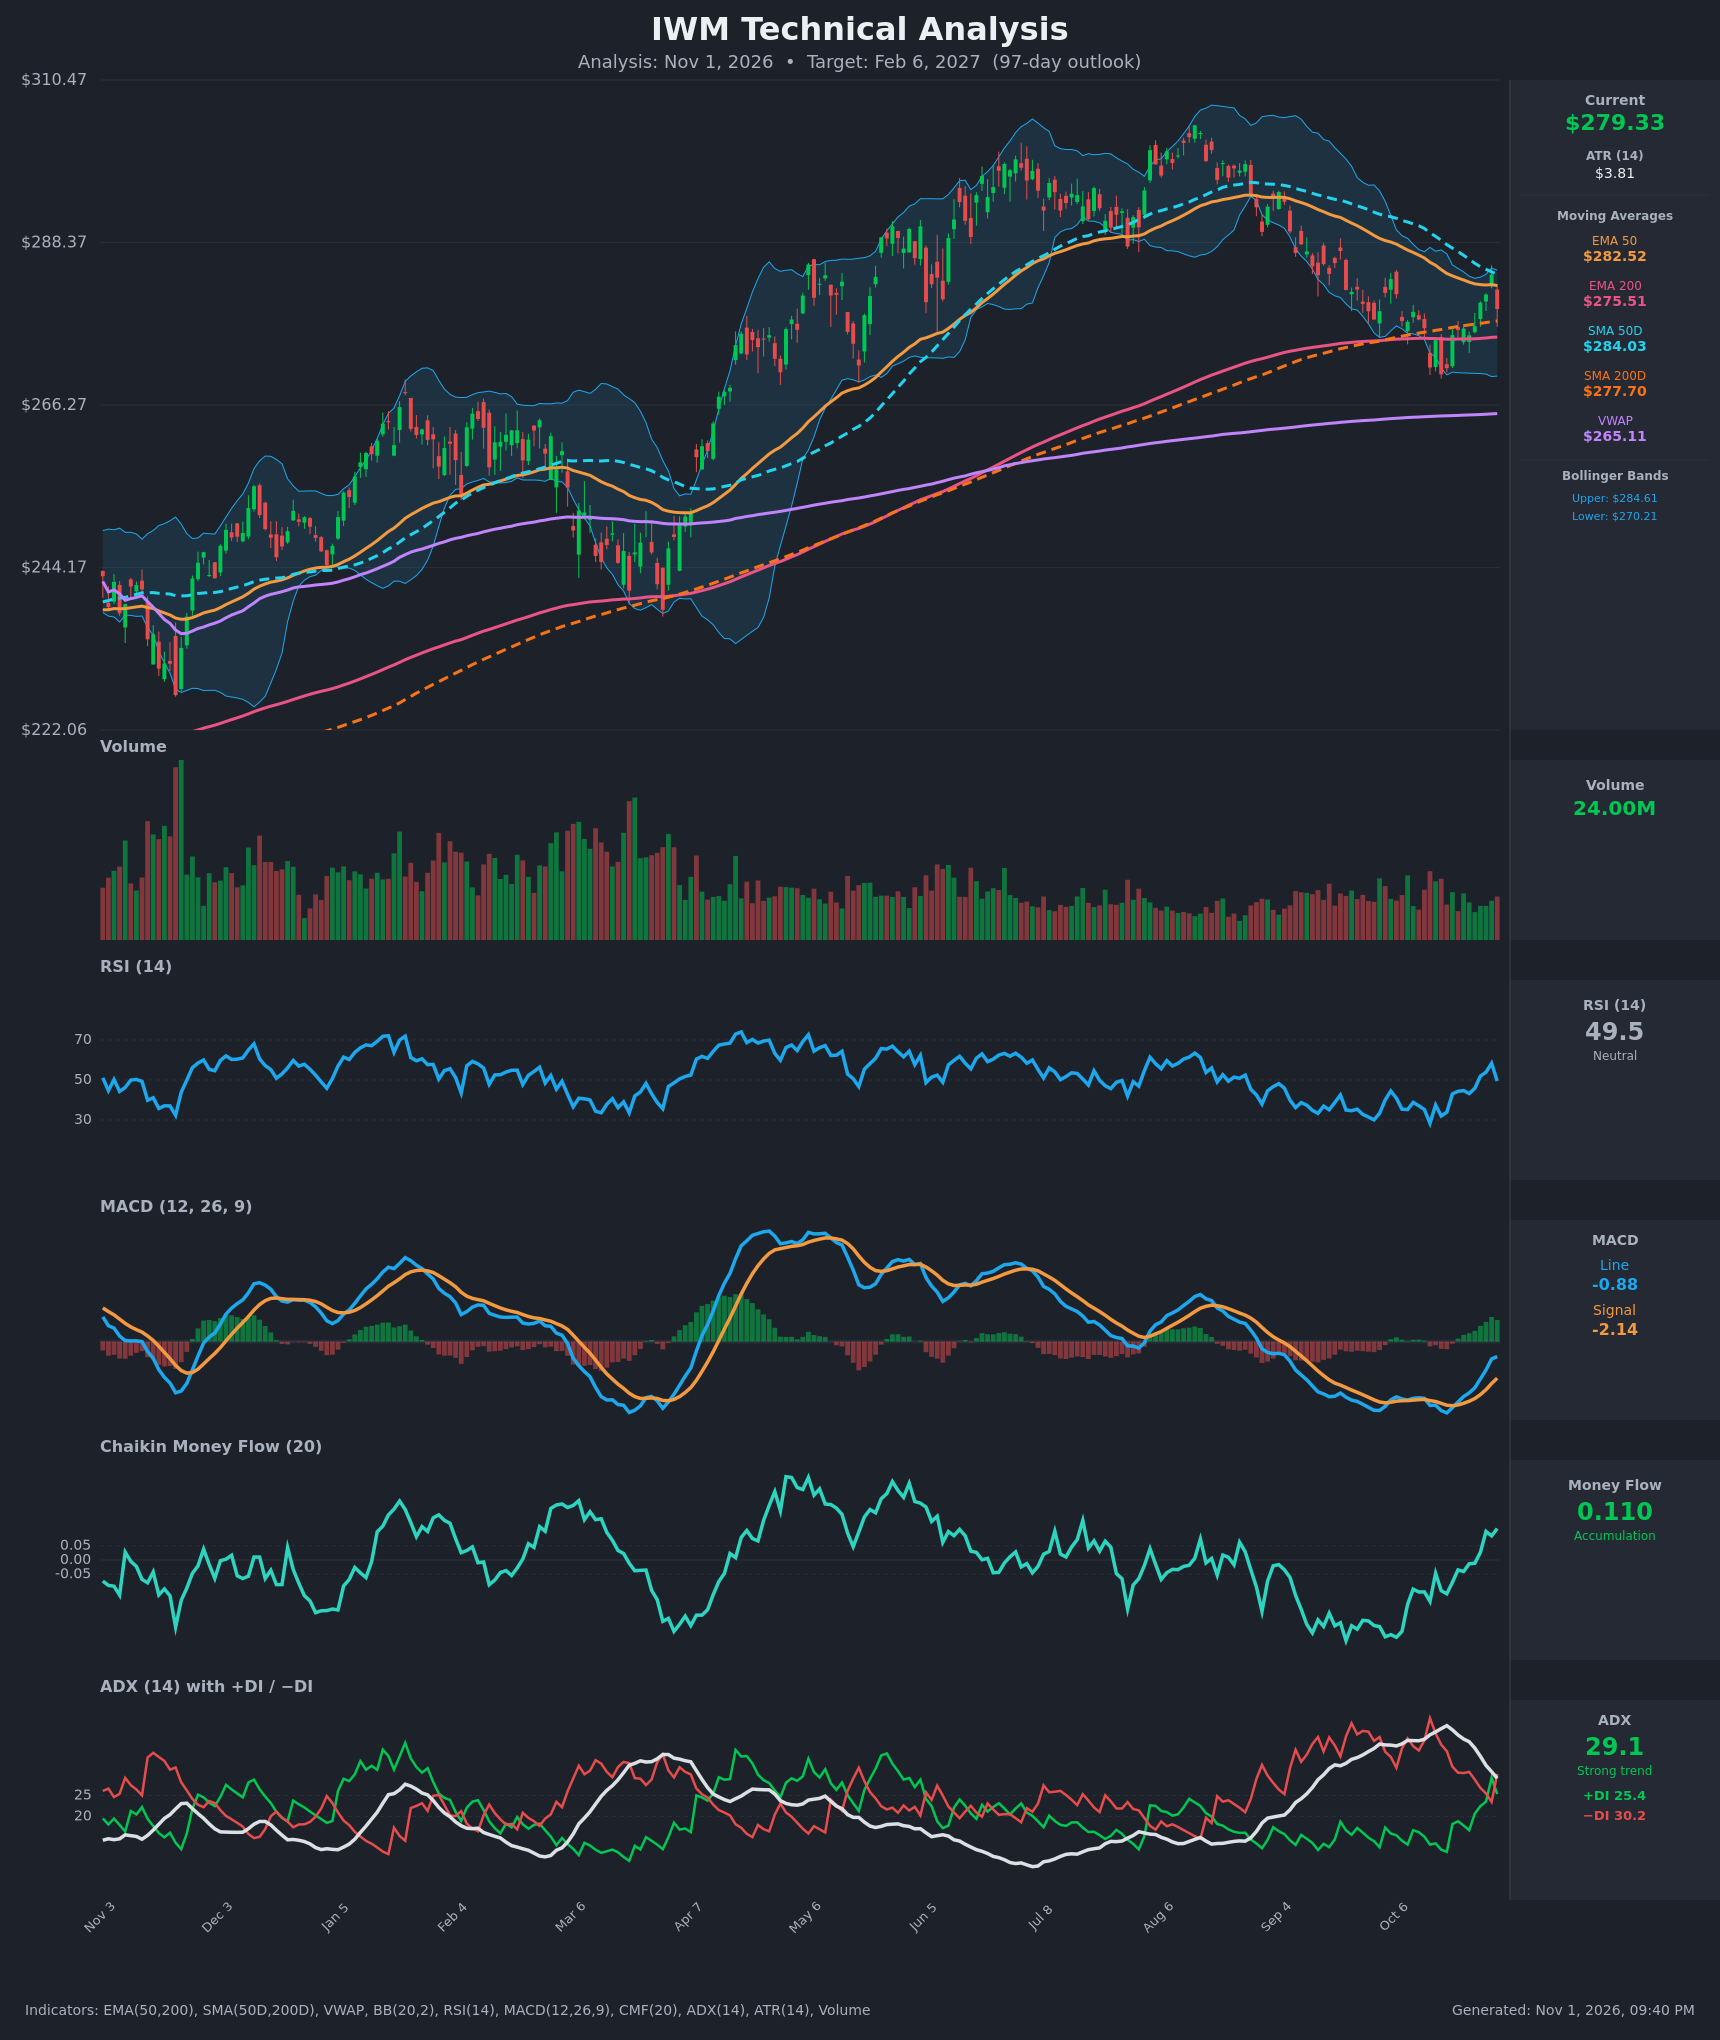
- RSI (14): 49.48, dead neutral. It fell from 58.4 the day before as price dropped from $284.01 to $279.33. It has recovered from an oversold 28.3 on Oct 14, but the last bar stalled the rebound. [Neutral]
- 20 EMA: The 20 EMA isn't supplied, so I use the EMA 50 at $282.52 as the proxy. Price is below it and was rejected right at it. EMA 50 is still sloping down, so it acts as near-term resistance. Price remains above EMA 200 ($275.51), which is the key support below. [Bearish]
- MACD: Line -0.875 is above signal -2.139, a bullish crossover that came in mid-October. The histogram is positive and rising, but both lines are still below zero. This is early momentum repair inside a larger correction, not a confirmed trend reversal. [Bullish]
- Bollinger Bands (20): Upper $284.61, lower $270.21, with price at $279.33 just below the midline (~$277.4) to slightly above it. The bands have narrowed from the September selloff. The rally stalled at the upper band ($284.01 close) and pulled back. Price is mid-range, which is neutral. [Neutral]
- CMF (20): +0.110, above the +0.05 threshold and up from -0.112 two weeks ago. Buying pressure has been building steadily through the October low and the bounce. [Accumulation]
- ADX (14): 29.1 and falling from 41.7, so the September–October downtrend is losing strength. −DI (30.2) is still above +DI (25.4), after +DI briefly led (29.2 vs 23.5) on Oct 29. Bears retain a slight edge, but the trend is fading. [Strong but weakening trend, Bearish bias]
- Volume: 24.00M, near average and without a spike. The October-low bounce came on modest volume, and the chart shows no capitulation or breakout surge. Volume is not confirming either side. [Neutral]
Other moving averages and VWAP:
- Price is above SMA200D ($277.70), EMA200 ($275.51) and VWAP ($265.11). These all support the long-term uptrend.
- Price is below SMA50D ($284.03) and EMA50 ($282.52), which are overhead resistance.
- Both 50-period averages are still above the 200s. No death cross has occurred, and the gap is narrowing.
DIVERGENCES & TRENDS
- Bullish divergence: Price made a lower low around $270.44 on Oct 16, while RSI (32.0) and MACD (-4.04) bottomed with only marginal confirmation. CMF turned positive and rose from its September trough. This favors a durable low.
- Momentum trend: MACD crossed up through its signal line on about Oct 20–23 and has risen since. RSI has climbed from the 28–32 area to the 50s before cooling at 49.5.
- ADX/DI: ADX peaked near 41.7 and has fallen to 29.1, a classic sign of a downtrend exhausting. +DI and −DI are converging. A decisive +DI cross above −DI would be a bullish trend-change signal.
- Moving-average structure: Price has bounced off the 200-day cluster ($275–278) twice. The failed push above the SMA50 on Oct 29–30 is the main bearish blemish.
- Higher-low structure: The October low (~$270) is far above the March low (~$240) and the early-year lows, so the multi-month uptrend remains intact.
CHART PATTERNS
- Bullish Double Bottom (minor, reversal): The Oct 14 ($271.37) and Oct 16 ($270.44) lows form a double bottom, with a neckline near $284–285 (the Oct 29 high and SMA50/upper BB). A close above ~$285 would target ~$298–299 (neckline + the ~$14 pattern height), close to the Aug–Sep highs near $300.
- Broader structure: The advance from March to August followed by the pullback to the 200-day averages resembles a retest of the breakout base. It is a correction within an uptrend, not a topping pattern. The Sept–Oct decline resembles a Bullish Falling Wedge, with the price bounce out of the wedge and upper-band rejection now acting as a retest.
- Risk pattern: The failure at $284 could develop into a lower high. A break below $270 would invalidate the double bottom and open a measured move toward ~$256–258.
POTENTIAL SCENARIOS
- Scenario 1: Bullish Double-Bottom Breakout — Price consolidates above the 200-day cluster and breaks the $284–285 resistance (SMA50/upper BB). MACD turns positive, +DI crosses above −DI, and CMF stays positive. Trigger: daily close above $285 with improving volume. Target: $298–$300 (prior highs and the double-bottom measured move), with a stretch toward $305. Invalidation: daily close below $270. (50% probability)
- Scenario 2: Bearish Failed-Bounce Breakdown — The rejection at the SMA50 becomes a lower high, with −DI still on top. Price loses the 200-day cluster and retests or breaks the October low. Trigger: daily close below $275.50 followed by a break of $270.20. Target: $258–$262, then ~$250. Invalidation: close above $285. (30% probability)
- Scenario 3: Neutral Range Chop — Price oscillates between the 200-day averages (~$270–276) and the 50-day averages (~$284) while ADX falls toward 20. Trigger: repeated failures at both ends of the range. Target: $275–$285. Invalidation: a close beyond $270 or $285. (20% probability)
PRICE TARGETS
For the 97-day horizon (to about Feb 6, 2027):
- Target Price: $291.00
- Expected Range: $258.00 to $313.00 (width $55 ≈ 19.7% of current price, consistent with the 61–180 day guidance)
- Key Levels: Support at $275.51 (EMA 200; major swing-low support at $270.44), Resistance at $284.03 (SMA50D; major resistance at ~$300)
OVERALL BIAS
OVERALL BIAS: BULLISH - Price is holding above the 200-day averages with a MACD bullish crossover, CMF accumulation (+0.110) and a fading ADX downtrend. A minor double bottom and bullish divergences support a recovery toward the $290–$300 area, though the rejection at the 50-day averages and −DI > +DI keep conviction modest.
This is educational analysis and not financial advice.