QCOM 97-day bearish forecast — Nov 1, 2026
- Bias: Bearish
- Timeframe: 97 days (made Nov 1, 2026, target date Feb 5, 2027)
- Price at analysis: $164.79
- Price target: $158.00
- Expected range: $141.00 – $180.00
- Result: Pending — graded after the close on Feb 5, 2027
Get a free AI analysis of QCOM today
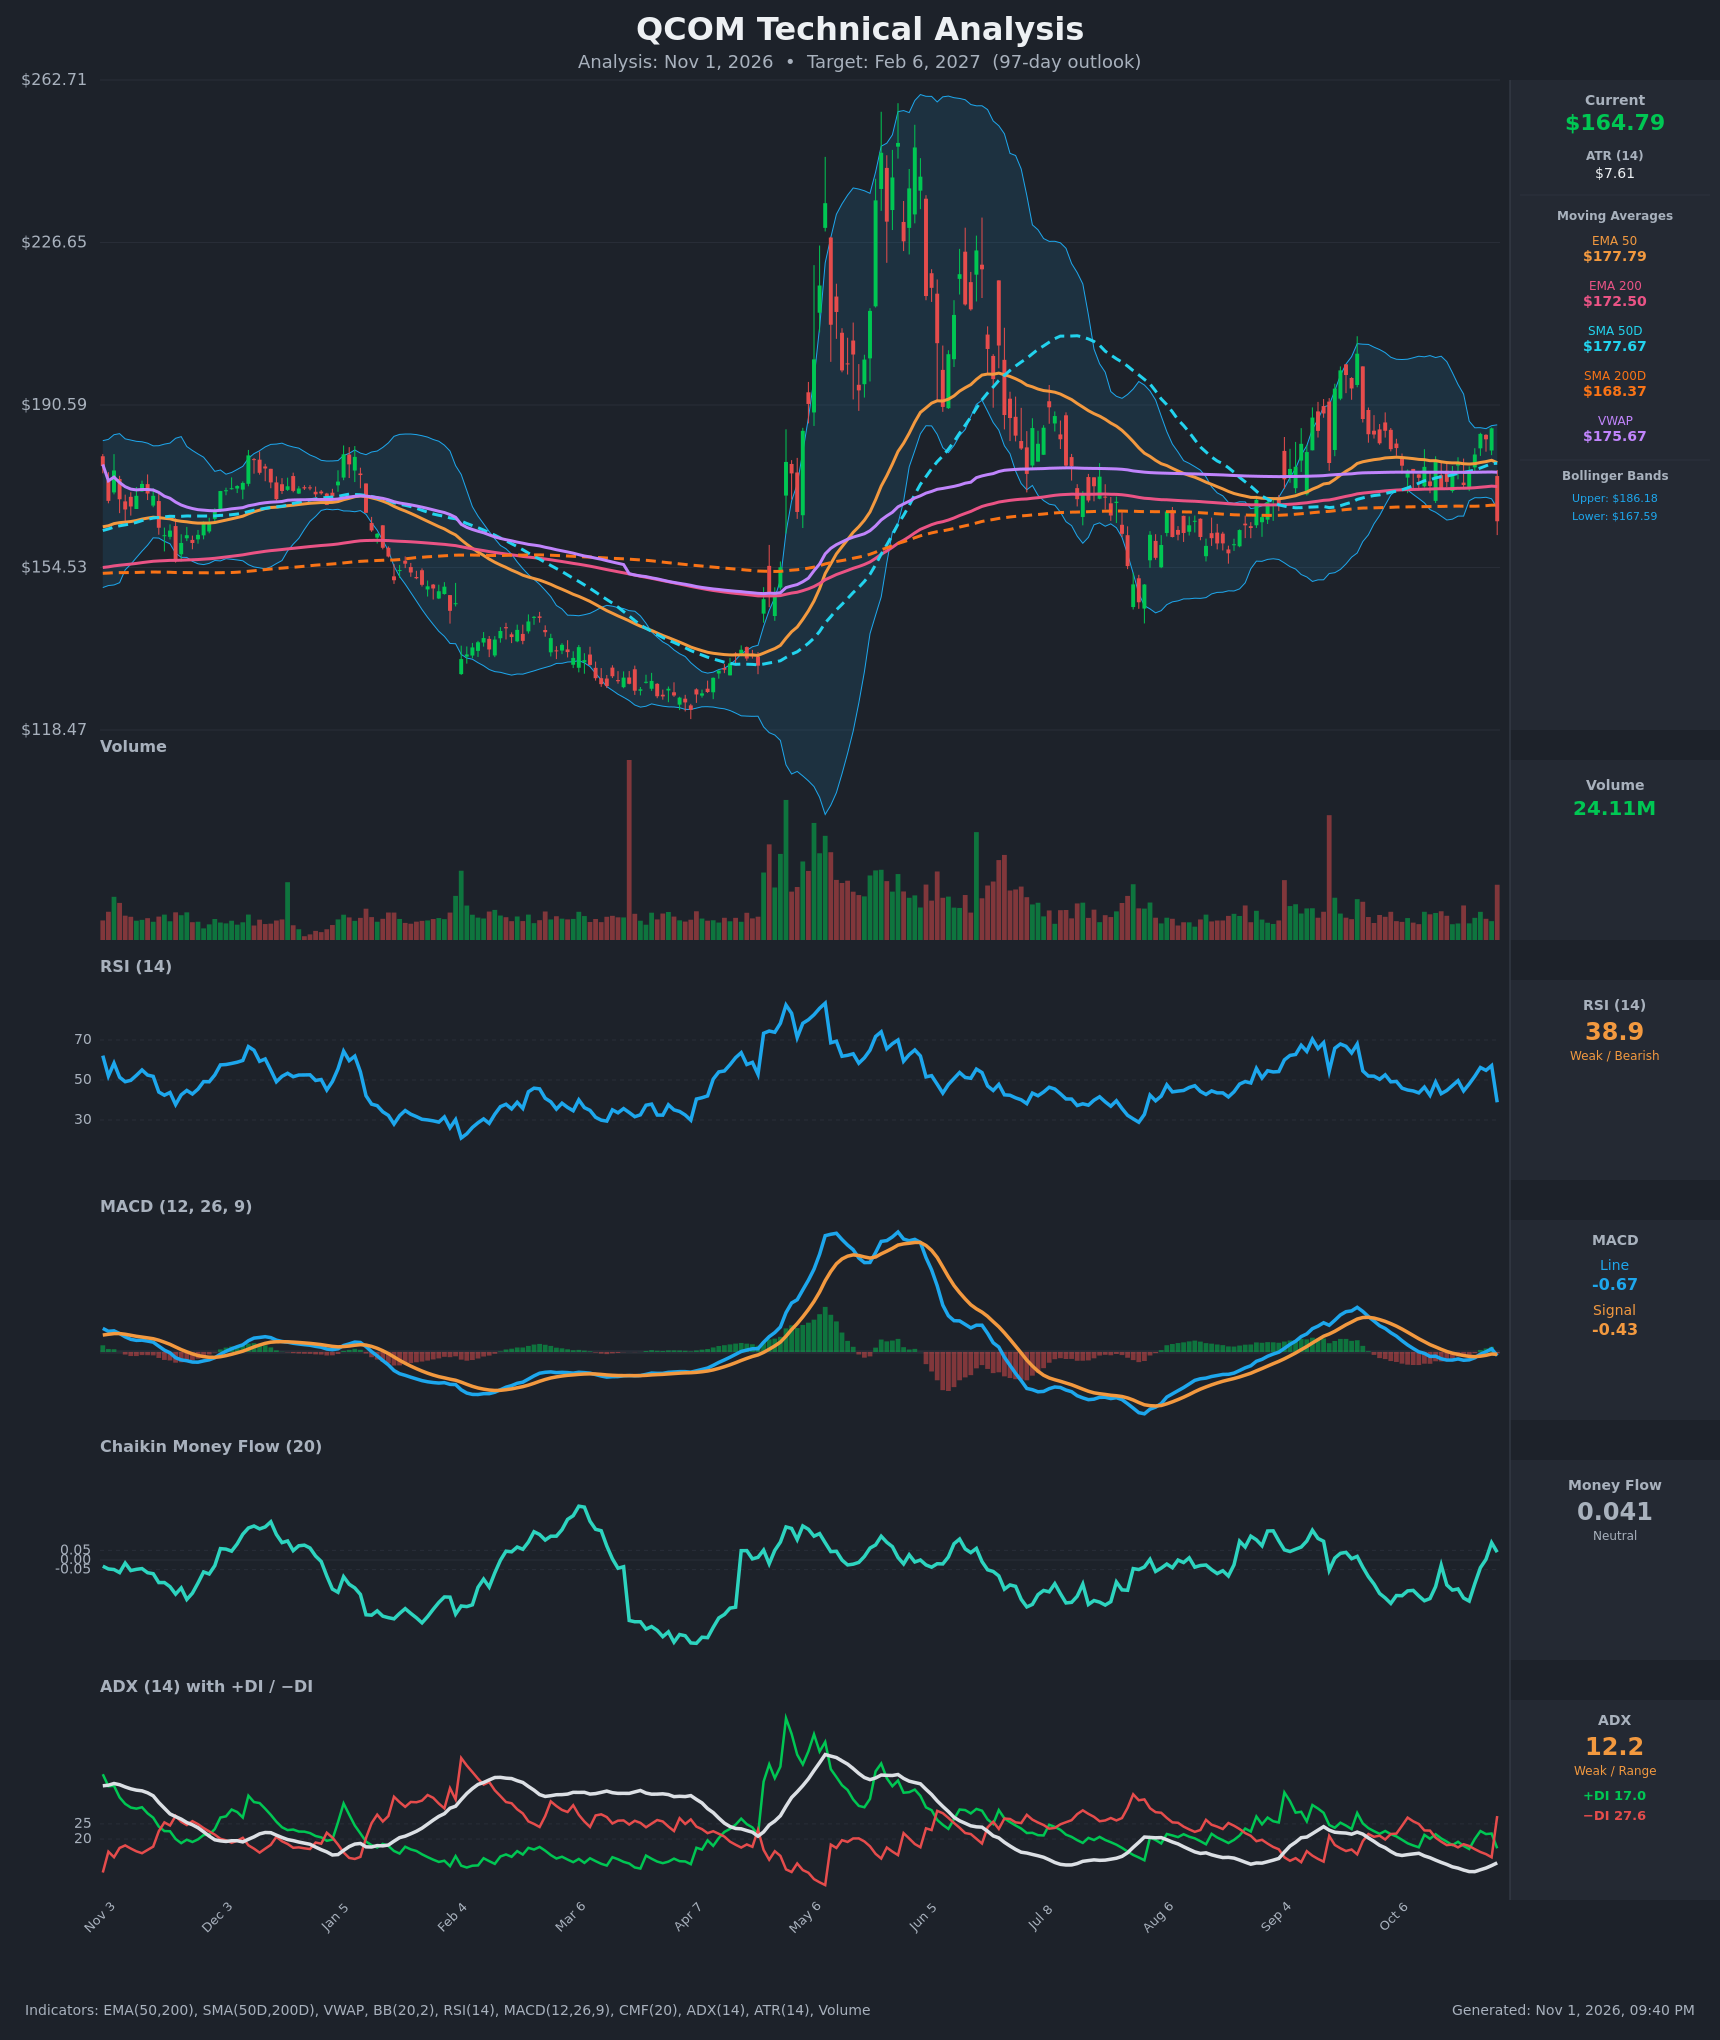
Analysis
TECHNICAL INDICATORS
- RSI (14): 38.86, down sharply from 57.2 one session earlier. It sits in the weak zone but is not yet oversold (<30), so there is room for further downside. Momentum has turned down. [Bearish]
- 20 EMA / EMA 50 / EMA 200: A 20 EMA was not supplied, so I use the EMAs provided. Price ($164.79) is below EMA 50 ($177.79) and EMA 200 ($172.50), and both now act as overhead resistance. VWAP ($175.67) is also well above price. EMA 50 remains above EMA 200, so there is no death cross yet, but the spread is narrowing. [Bearish]
- MACD: Line -0.665 is below Signal -0.428. The line was +0.569 the day before, so this is a fresh bearish crossover. The histogram flipped negative. Both lines sit near zero, so the signal is only moderately strong. [Bearish]
- Bollinger Bands (20): Price closed below the lower band ($167.59) and far below the upper band ($186.18), after riding the upper half the previous 3 sessions. A close outside the band after an 11% one-day drop shows an expansion in volatility. It can mean a short-term stretch, but it is not a reversal signal on its own. [Bearish]
- CMF (20): 0.041 is neutral (between -0.05 and +0.05). It had just turned positive in the last 3 sessions, but one heavy down day has not yet pushed it into distribution. Watch for a roll-over below -0.05. [Neutral]
- ADX (14): 12.2 with −DI 27.6 above +DI 17.0. The trend is weak, but the DI spread flipped sharply to the bears (+DI was 21.8 and −DI 14.0 the day before). The market was range-bound and is now getting a bearish directional impulse. [Weak Trend, Bearish Direction]
- Volume: 24.11M is a clear spike versus the typical recent bars, on a large red candle (-11.1%, from $185.41 to $164.79). This looks like event-driven (likely earnings) distribution, which makes the breakdown more credible. [Bearish Interpretation]
DIVERGENCES & TRENDS
- There is no classic divergence. RSI and MACD fell in line with price, and the rally to $185 had been confirmed by RSI reaching 57.
- RSI has been range-bound at 38–57 since September, and the long-term pattern is lower highs (RSI peaked near 85 in May, then about 70 in Sep).
- The SMA50D ($177.67) is above the SMA200D ($168.37), so no death cross has occurred. The SMA50D is flattening, and price has now lost both the SMA50D and SMA200D, which is a notable break.
- MACD crossed down through the signal line from just under the zero line. Earlier in the month the MACD histogram was negative and recovering, so this is a failure of that recovery.
- The −DI/+DI crossover to the bearish side is the key trend change. ADX is still low, so a sustained trend is not yet confirmed.
- Price is below the SMA200D for the first time since the Aug lows, a long-term deterioration.
CHART PATTERNS
- Bearish Rectangle / Triple-Top-style range breakdown: Price consolidated in a roughly $172–$185 range through October (the ADX fell to 9–12). The 11% gap down broke below the range floor. The measured move is about the range height (~$13) subtracted from $172, giving roughly $159.
- Lower high structure (Bearish Double Top flavour): The September peak near $205 and the October high near $185 form a lower high. This supports the case that the rally from the Aug lows ($143) has failed.
- The reference diagram has no exact match. This is a bearish range breakdown with a possible retest of the broken range from below ($168–$172, where the SMA200D and EMA 200 sit).
- Potential counter-pattern: The Aug–Oct low area ($154–$160) could form a Bullish Double Bottom if tested again and held.
POTENTIAL SCENARIOS
- Scenario 1: Bearish Post-Event Drift / Range Breakdown — The gap down on heavy volume, the MACD and DI bearish flips and the loss of the SMA200D lead to a retest of the SMA200D/EMA 200 zone from below, which fails, and then a drift toward the $155 support. Trigger: failure to reclaim $168.37–$172.50 and a daily close below $160. Target: $155–$158, with an extension to $145–$150 on a break of $154. Invalidation: daily close above $177 (EMA 50/SMA50D). (50% probability)
- Scenario 2: Bullish Mean-Reversion Rebound — The close below the lower Bollinger Band and the oversold-leaning RSI attract dip buyers, the CMF stays neutral-positive, and price fills part of the gap back toward the VWAP. Trigger: a daily close above $168.37 followed by $172.50. Target: $175–$178. Invalidation: a close below $158. (30% probability)
- Scenario 3: Neutral Base-Building — Price stabilises in a $155–$172 range as ADX stays low, forming a base under the SMA200D. Trigger: repeated holds above $155 with declining volume. Target: $160–$168. Invalidation: a close outside $152–$175. (20% probability)
PRICE TARGETS
- Target Price: $158.00 (97-day horizon, to about Feb 6, 2027)
- Expected Range: $141.00 to $180.00 (width $39.00, about 23.7% of the current price, consistent with the 61–180 day guidance of 18–30%)
- Key Levels: Support at $154.50, Resistance at $168.37
OVERALL BIAS
OVERALL BIAS: BEARISH - Price broke down on heavy volume from an $172–$185 range, closed below the lower Bollinger Band, the SMA200D and both EMAs, and has a fresh bearish MACD crossover with −DI well above +DI. The measured move points to about $159, and conviction is moderate given the weak ADX and the chance of a mean-reversion bounce.
This is educational analysis and not financial advice.