SMCI 97-day bearish forecast — Nov 1, 2026
- Bias: Bearish
- Timeframe: 97 days (made Nov 1, 2026, target date Feb 5, 2027)
- Price at analysis: $32.95
- Price target: $30.00
- Expected range: $23.50 – $39.00
- Result: Pending — graded after the close on Feb 5, 2027
Get a free AI analysis of SMCI today
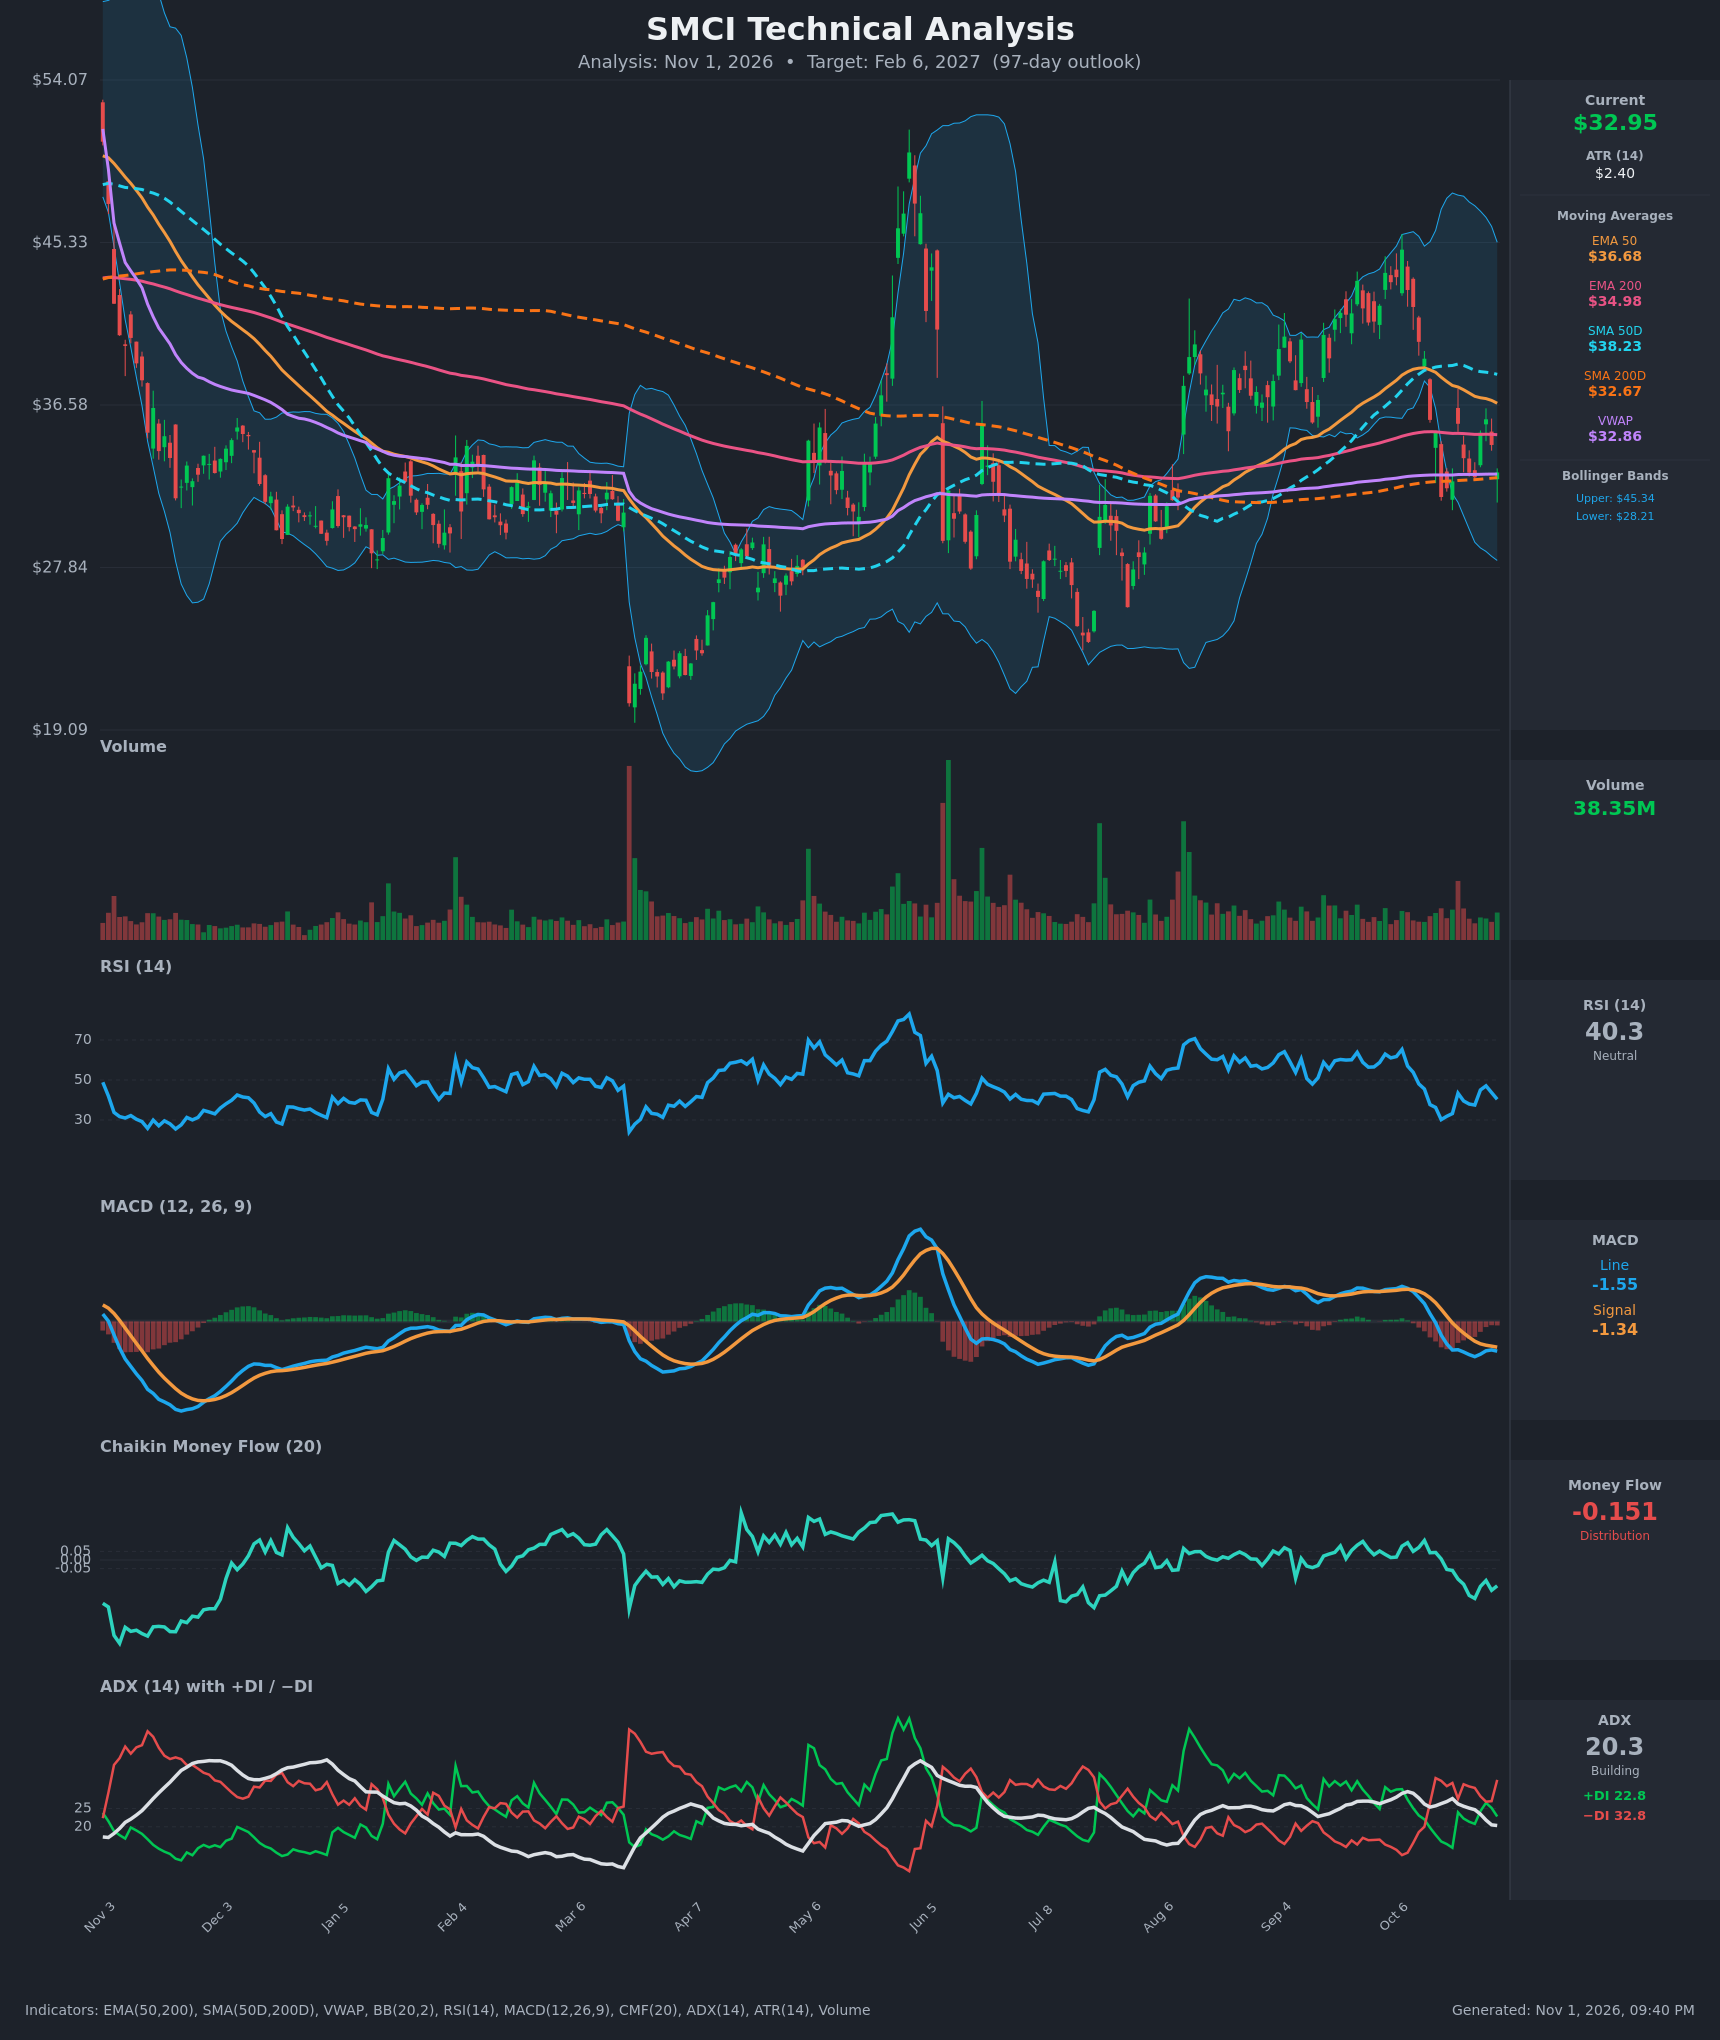
Analysis
TECHNICAL INDICATORS
- RSI (14): 40.35, below the 50 midline and recovering off the ~30 oversold touch on Oct 16. The bounce to 47 failed and RSI is rolling over again. Momentum is soft with no oversold signal. [Bearish]
- 20 EMA: No 20 EMA value was supplied. Using the EMA 50 at $36.68 as the proxy, price at $32.95 sits about 10% below it, so it acts as overhead resistance. The EMA 50 is falling (38.56 → 36.68 in 15 bars). [Bearish]
- MACD: Line -1.55 is below signal -1.34, with a bearish crossover on Oct 20 and a negative histogram. Both lines are below zero but flattening, so downside momentum is slowing without a bullish cross yet. [Bearish]
- Bollinger Bands (20): Upper $45.34, lower $28.21, midline about $36.78. Price is in the lower half, below the midline, with wide bands showing high volatility. There is no squeeze, and the lower band is about 14% below price. [Bearish]
- CMF (20): -0.151, well below -0.05 and falling from +0.114 on Oct 13. This is clear distribution. [Distribution]
- ADX (14): 20.3 and fading from 27.8, so the trend is weak. -DI at 32.8 is above +DI at 22.8, so bears control direction, but the low ADX means the trend is not strong. [Weak Trend + Bearish]
- Volume: 38.35M, roughly average with no capitulation spike. Selling on the Oct 14-16 drop was heavier than the buying on the bounces. [Neutral to Mildly Bearish]
Other levels:
- SMA200D: $32.67, so price is just above the long-term trend line, which is acting as the key support.
- EMA 200: $34.98, overhead resistance.
- SMA50D: $38.23, and still above SMA200D.
- VWAP: $32.86, so price is only marginally above it.
DIVERGENCES & TRENDS
- There is no clear bullish divergence. RSI's Oct 16 low (30.2) came with price at $31.63, and the Oct 26 retest low at $32.69 had an RSI of 37.5. That is a mild higher low in RSI, but it is not confirmed.
- MACD histogram is shrinking in magnitude, which hints at slowing downside momentum, but the bearish crossover is still in force.
- EMA 50 has crossed below the 38 area and is converging toward EMA 200 ($34.98). A bearish EMA cross is likely within weeks if price stays under $35.
- SMA50D ($38.23) is rolling over toward SMA200D ($32.67). The gap is still wide, so a death cross is not imminent but is trending that way.
- The DI crossover on Oct 14 gave bears control. A brief +DI push on Oct 28 failed.
- CMF has deteriorated from accumulation to distribution while price held near $33. Selling pressure leads price here.
CHART PATTERNS
- The chart shows a broad choppy structure since Nov. The $28-$36 base ran Jan-Mar, followed by a spike to about $50 in late May and a retracement. The Aug-Oct rally to about $45 has since retraced fully to the SMA200D.
- The Aug-Oct rally followed by this drop resembles a Bearish Double Top / Head and Shoulders-style reversal. The late-May peak (~$50) was the head, and the Oct high (~$43-45) was a lower right shoulder. The neckline sits at roughly $31-32 (Oct 16 low $31.63 and the SMA200D area).
- A close below $31.60 would confirm the break. The measured target is roughly $20-$22, but that is an aggressive extension for 97 days.
- The pattern is not confirmed, because price is still holding the neckline and SMA200D. A Bearish Flag/Pennant reading is also plausible if the bounces to $35.8 stay capped.
- Support is $31.6 and then $28.2 (lower BB and prior base). Resistance is $35.8 and then $36.7-$38.2.
POTENTIAL SCENARIOS
- Scenario 1: Bearish Neckline Break and Drift Lower — The $31.6 neckline and SMA200D give way under persistent distribution (CMF -0.15) and -DI dominance. The EMA 50/200 bearish cross adds pressure. Trigger: daily close below $31.60 on rising volume. Target: $27-$28, with an extension toward $24. Invalidation: reclaim of $36.7 (EMA 50). (50% probability)
- Scenario 2: Bullish Support Hold and Recovery — The SMA200D holds, RSI forms a higher low, and price rebuilds toward the EMA 200 and the midline. Trigger: close above $35.8 with MACD bullish cross. Target: $37-$38.5. Invalidation: close below $31.60. (30% probability)
- Scenario 3: Neutral Range Chop — Price oscillates between $29 and $36, with ADX under 20 and no resolution. Trigger: failure of both breakouts. Target: $31-$34. Invalidation: decisive close outside $28.2-$36.7. (20% probability)
PRICE TARGETS
- Target Price: $30.00 (97 days, Feb 6, 2027)
- Expected Range: $23.50 to $39.00 (width $15.50, about 47% of price). This is wider than the 18-30% guide because ATR is high at 7.3% of price and SMCI is highly volatile. The self-check confirms it is much wider than any short-term range.
- Key Levels: Support at $31.60, Resistance at $35.80
OVERALL BIAS
OVERALL BIAS: BEARISH - Price is below the falling EMA 50, MACD is bearish, CMF shows clear distribution at -0.15, and -DI is dominant, while the neckline at the SMA200D is the last defense. The bearish scenario carries the most weight, though the weak ADX caps conviction.
This is educational analysis and not financial advice.