TQQQ 97-day bearish forecast — Nov 1, 2026
- Bias: Bearish
- Timeframe: 97 days (made Nov 1, 2026, target date Feb 5, 2027)
- Price at analysis: $62.01
- Price target: $57.50
- Expected range: $49.50 – $66.50
- Result: Pending — graded after the close on Feb 5, 2027
Get a free AI analysis of TQQQ today
Analysis
TECHNICAL INDICATORS
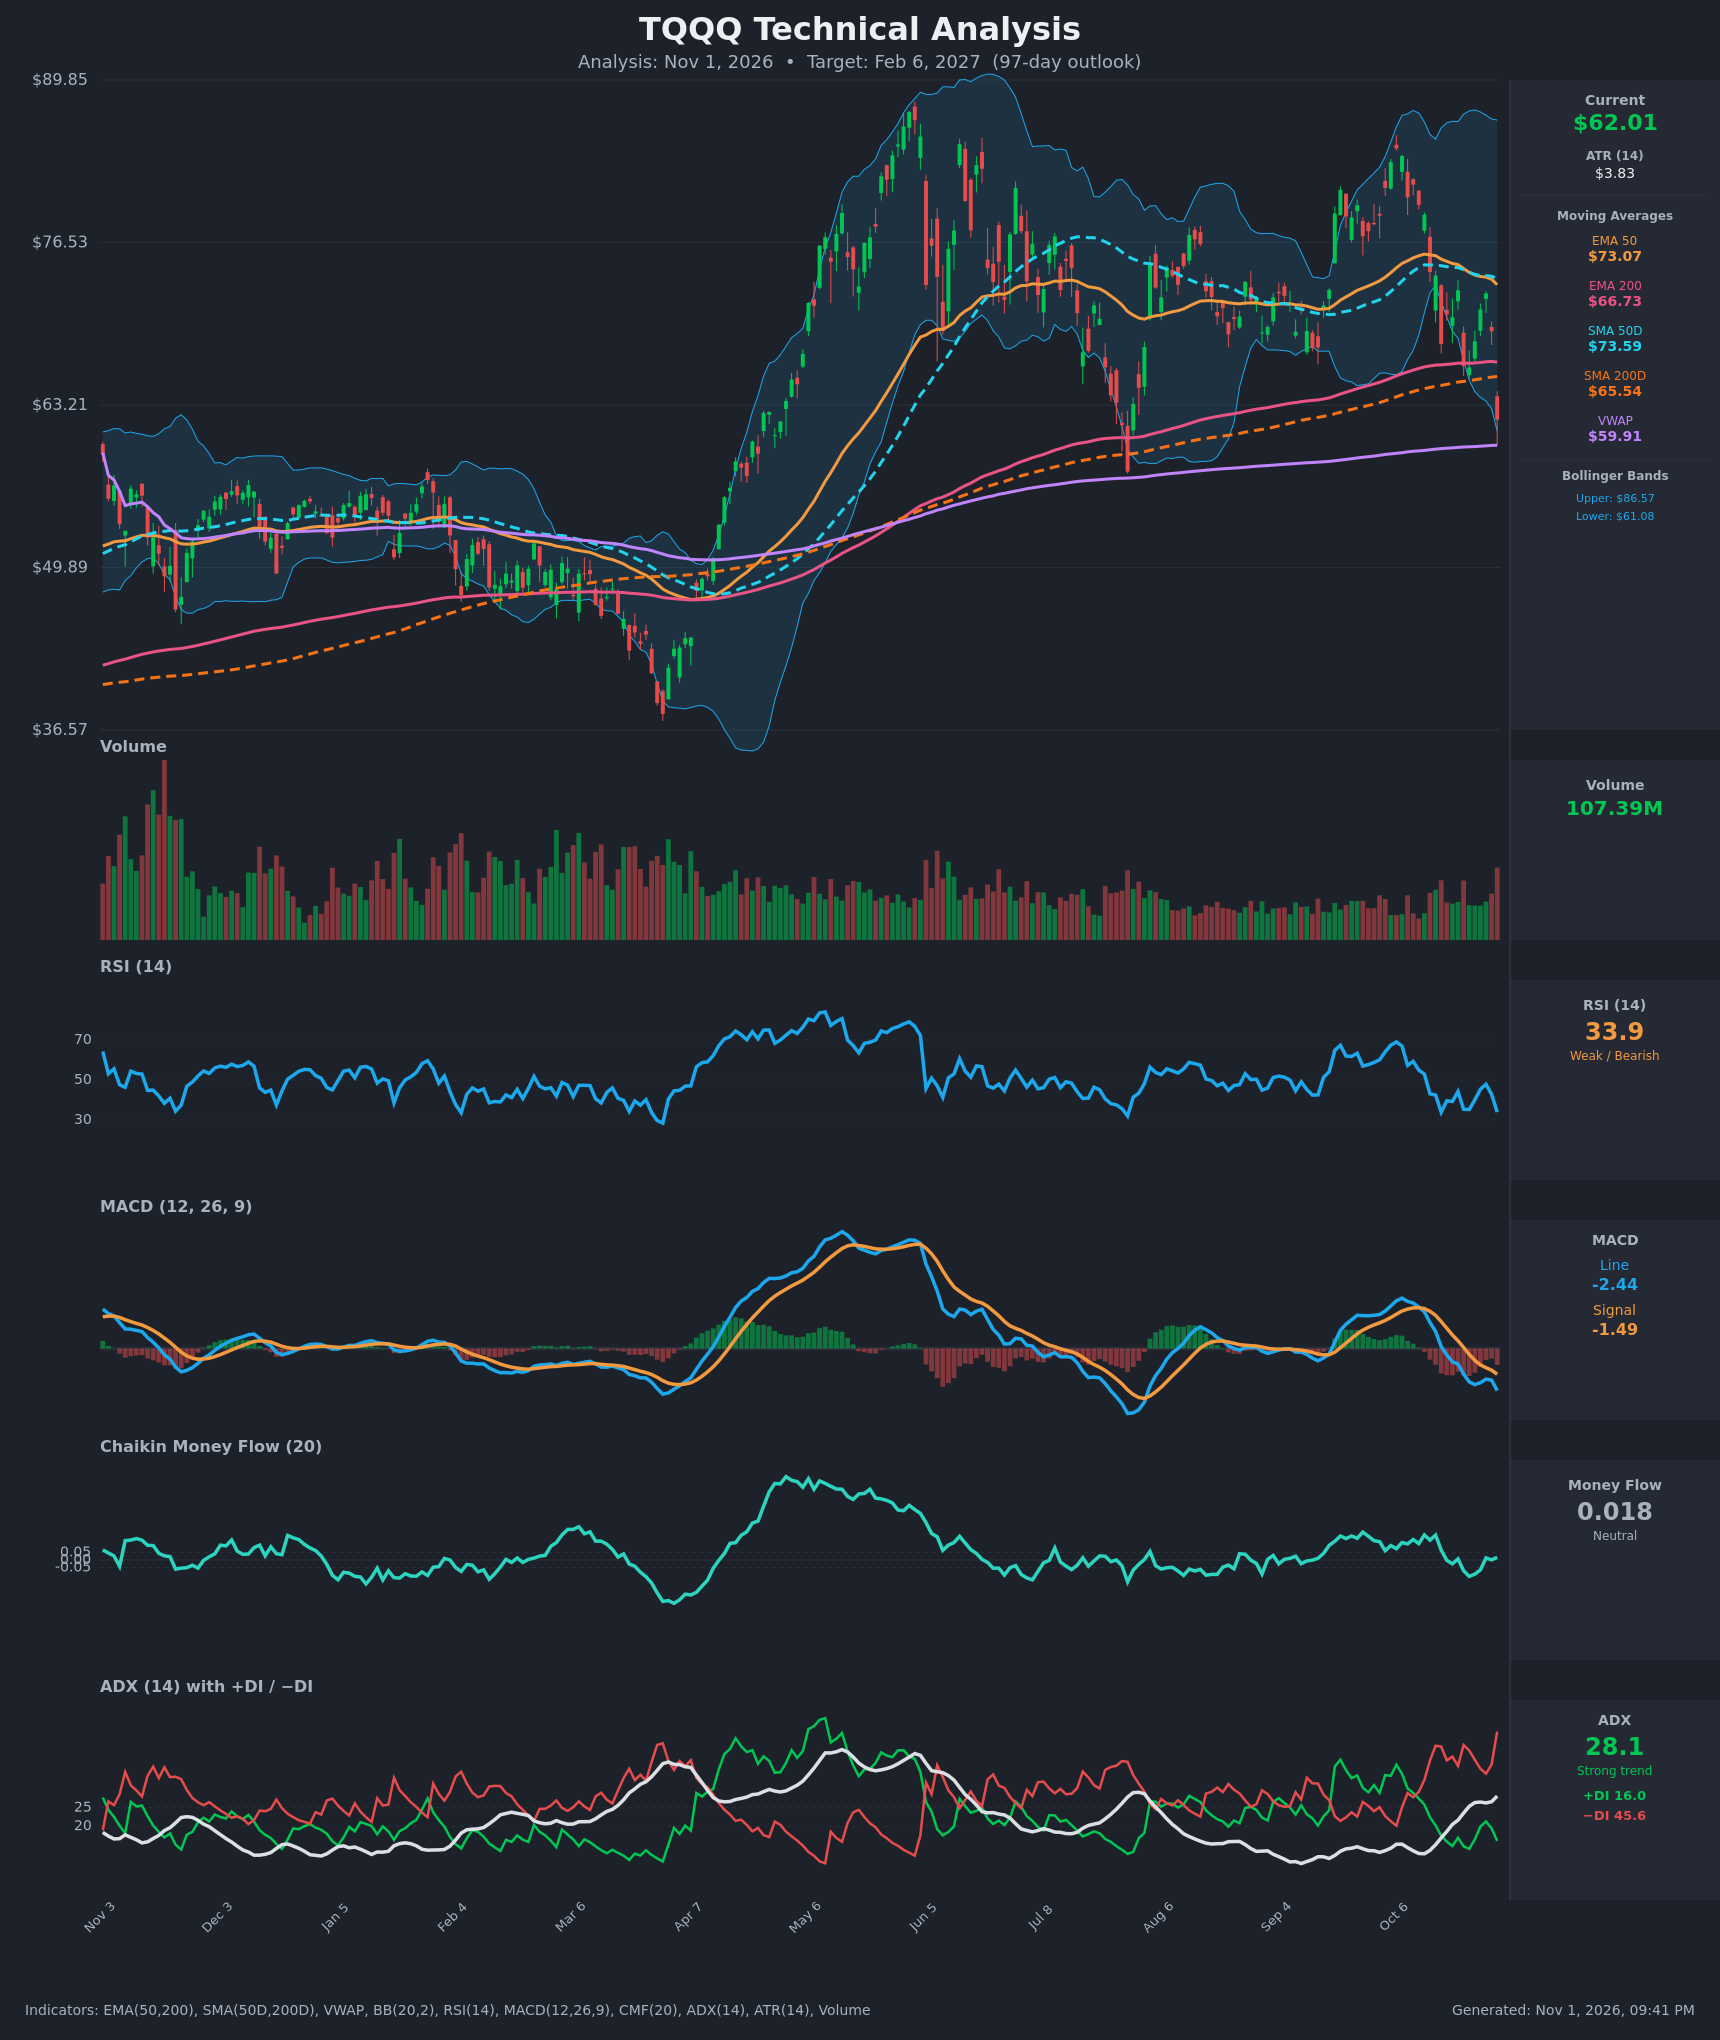
- RSI (14): 33.95, down from about 48 on Oct 28 and approaching oversold. It has made lower highs since the 68 reading in early October, and momentum is clearly falling. [Bearish]
- 20 EMA: The 20 EMA is not supplied. The nearest data are the EMA 50 at $73.07 and EMA 200 at $66.73. Price at $62.01 sits below both, and the 50 EMA is rolling over, so both act as overhead resistance. [Bearish]
- MACD: The line is -2.44 against a signal of -1.49. It crossed below the signal around Oct 16-19 and crossed below zero on Oct 19. The histogram is negative and widening, so downside momentum is accelerating. [Bearish]
- Bollinger Bands (20): Upper band $86.57, lower band $61.08. Price at $62.01 is hugging the lower band after a wide-range drop. The bands are wide, so volatility is elevated. A walk along the lower band is possible in a strong downtrend, but a mean-reversion bounce is also likely. [Neutral]
- CMF (20): 0.018, inside the ±0.05 neutral zone. It slipped negative in late October and has only barely recovered, so there is no strong accumulation to support a rebound. [Neutral]
- ADX (14): 28.1 and rising (from 12.5 on Oct 13) with −DI 45.6 far above +DI 16.0. This is a strong, fresh downtrend with bears firmly in control. [Strong Trend – Bearish]
- Volume: 107.39M, a spike on the latest -10.5% down bar and the heaviest volume in recent weeks. A large drop on rising volume indicates real selling pressure rather than a quiet pullback. [Bearish – Distribution/Capitulation Risk]
DIVERGENCES & TRENDS
- There is no bullish RSI or MACD divergence yet. Both are making lower highs and lower lows alongside price.
- Price broke below both the EMA 200 ($66.73) and SMA 200 ($65.54) in a single session, a key long-term trend break.
- The EMA 50 ($73.07) and SMA 50 ($73.59) are above the 200-period averages but turning down. A bearish cross is not yet in place but is possible if weakness persists.
- Price is only about 3.5% above VWAP ($59.91), which is the nearest structural support.
- The ADX rise from 12 to 28 with a −DI surge confirms a new bearish trend phase.
- The oversold-leaning RSI and the lower-band touch raise the odds of a relief bounce, but nothing has confirmed a reversal.
CHART PATTERNS
- Bearish Double Top (broad): Peaks near $89 (May) and about $83-84 (early October) with a lower second high. The neckline area is the $55-57 August low. The break of the $66-67 mid-range and the 200-day averages is the first step toward a full breakdown. A full measured move would be far lower, but the 97-day target is moderated for that.
- Range breakdown: Price chopped between about $66 and $84 from June to October and has now dropped out of the bottom of that range. A range-height projection points to roughly the high $40s.
- Possible Bullish Falling Wedge or Double Bottom: Not confirmed. It would need a reclaim of $66-67.
POTENTIAL SCENARIOS
- Scenario 1: Bearish Trend Continuation — The 200-day breakdown extends as −DI stays dominant, and price retests VWAP and the August low area. Trigger: daily close below the $59.91 VWAP and the $61.08 lower band. Target: $55.00, then $50-52. Invalidation: daily close back above $66.73 (EMA 200). (50% probability)
- Scenario 2: Bullish Oversold Relief Rally — RSI near 30 and the lower-band touch spark a mean-reversion bounce. Price reclaims the 200-day averages and rises toward the declining 50-day averages. Trigger: close above $65.54-$66.73 with MACD histogram flattening. Target: $73-74. Invalidation: loss of $59.91 and a new low. (33% probability)
- Scenario 3: Neutral Basing Range — Price stabilizes between VWAP and the 200-day averages. Trigger: ADX falling back below 25 and RSI holding 35-50. Target: $58-66 range. Invalidation: close outside $55-$67. (17% probability)
PRICE TARGETS
- Target Price: $57.50 (97-day)
- Expected Range: $49.50 to $66.50. The width is $17.00, or about 27.4% of the current price, which fits the 61-180 day guidance of 18-30%.
- Key Levels: Support at $59.91 (VWAP), then $55.00. Resistance at $65.54 (SMA 200), then $66.73 (EMA 200).
OVERALL BIAS
OVERALL BIAS: BEARISH - A strong, rising ADX with −DI far above +DI, a bearish MACD below its signal, and a high-volume break below both 200-day averages outweigh the oversold-leaning RSI. A relief bounce is possible, but the trend evidence favors lower prices over 97 days.
This is educational analysis and not financial advice.