XLE 97-day bullish forecast — Nov 1, 2026
- Bias: Bullish
- Timeframe: 97 days (made Nov 1, 2026, target date Feb 5, 2027)
- Price at analysis: $70.02
- Price target: $73.50
- Expected range: $62.50 – $79.00
- Result: Pending — graded after the close on Feb 5, 2027
Get a free AI analysis of XLE today
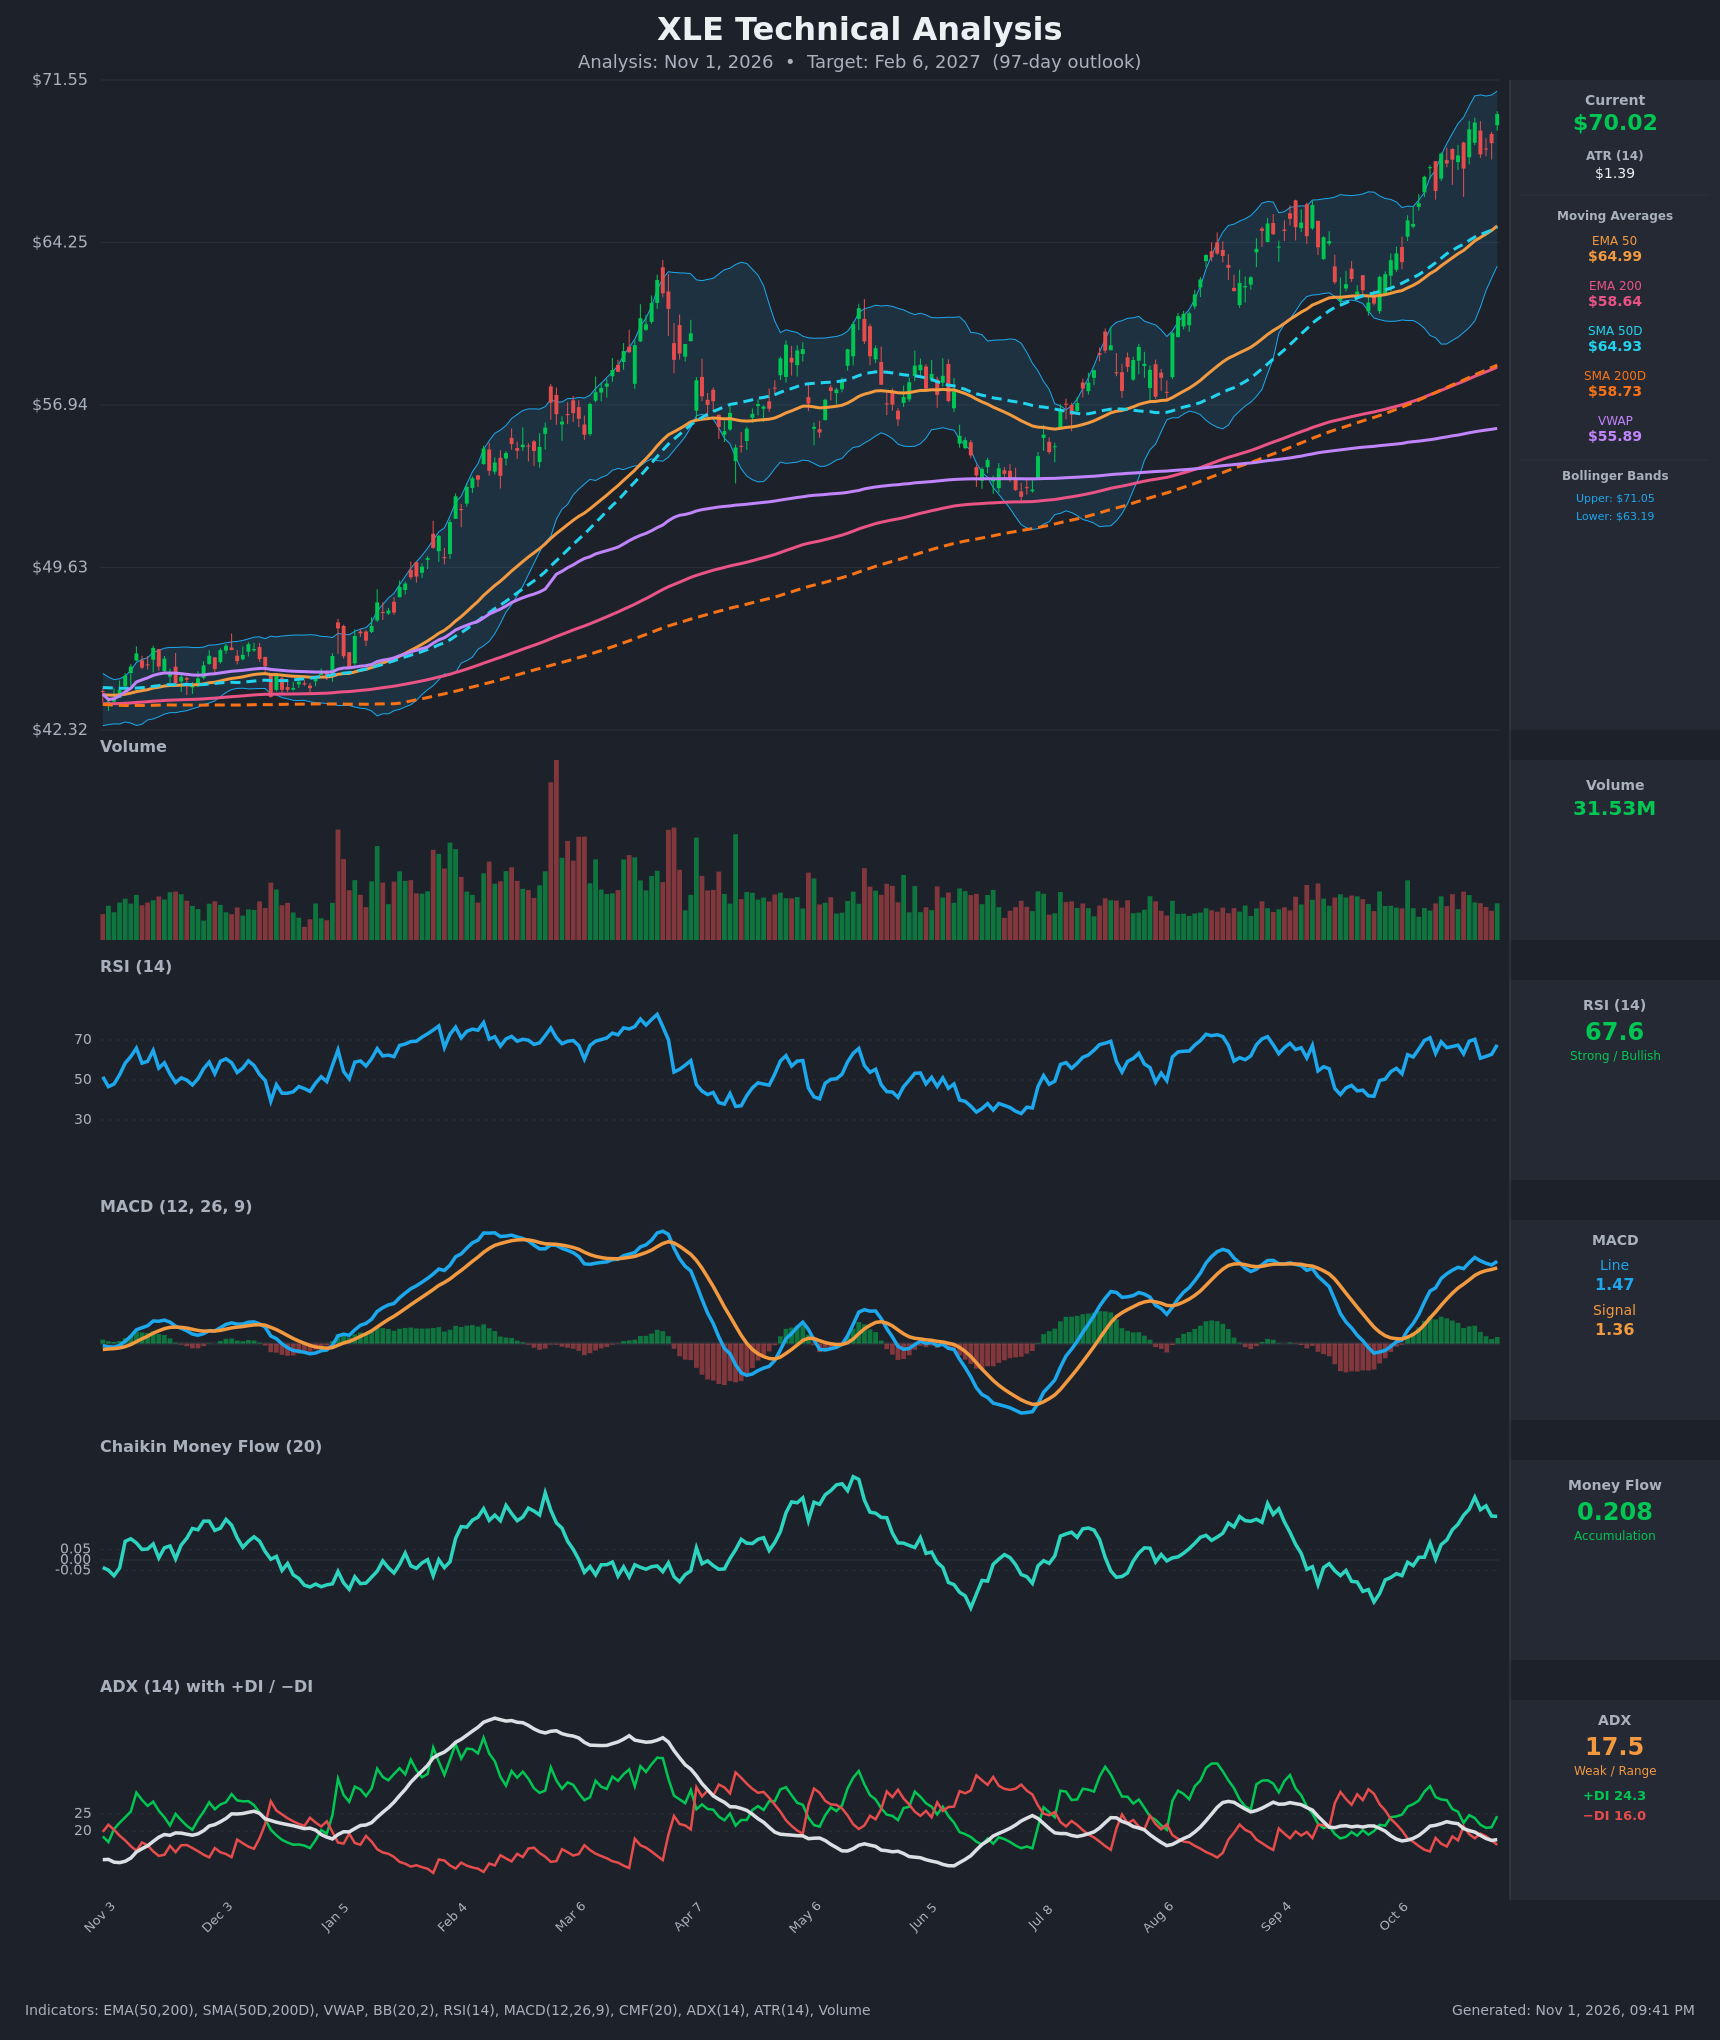
Analysis
TECHNICAL INDICATORS
- RSI (14): 67.58, just under the 70 overbought line. It peaked at 71.1 on Oct 14 and 70.3 on Oct 26, and it has held between 61 and 70 for three weeks. That is a strong but extended momentum regime. [Bullish]
- 20 EMA: The 20 EMA isn't supplied, so I use the 50-day averages instead. Price at $70.02 is about 7.7% above the EMA 50 ($64.99) and the SMA 50D ($64.93), which now act as dynamic support. Price is also far above the EMA 200 ($58.64) and SMA 200D ($58.73). The stack is fully bullish, but price is stretched from the mean. [Bullish]
- MACD: The line (1.473) is above the signal (1.357), so the histogram is positive at about +0.12. The line peaked at 1.543 on Oct 26 and pulled back, but it has turned up again over the last two bars. Momentum is positive but not accelerating. [Bullish]
- Bollinger Bands (20): Price is at $70.02, close to the upper band ($71.05) and far above the lower band ($63.19). The bands are widening and price is walking the upper half. That shows strength, but it also raises short-term mean-reversion risk. [Bullish]
- CMF (20): 0.208, well above +0.05, and it has been positive for 15 straight bars and rising since Oct 12 (0.013). This is sustained accumulation, and buying is backing the rally. [Accumulation]
- ADX (14): 17.5 and falling from 22.7. +DI (24.3) is above −DI (16.0), so bulls control direction, but the weak ADX means the trend is not strongly established. [Weak Trend, bullish direction]
- Volume: 31.53M, which is average and not climbing during the breakout to new highs. Accumulation is steady but there is no surge, so conviction is moderate. [Neutral to mildly bullish]
DIVERGENCES & TRENDS
- Mild bearish divergences: Price has made a higher high at $70.02 while RSI sits below its Oct 14 peak (71.1). The MACD line is also below its Oct 26 peak (1.543), and ADX has fallen from 22.7 to 17.5 as price rises. The advance is losing some trend energy.
- Bullish confirmation: CMF is at a 20-bar high area (0.208 vs 0.013 two weeks ago). That is the opposite of distribution and argues against a sharp reversal.
- Moving averages: The golden cross is long established (SMA50D $64.93 vs SMA200D $58.73), and the EMA 50 is above the EMA 200. Both 200-day averages are still rising, which supports a long-term uptrend.
- Crossovers: The MACD has been above its signal line since mid-October. +DI has been above −DI throughout, apart from a brief near-cross on Oct 22 (22.3 vs 21.4).
- VWAP: Price is far above VWAP ($55.89), so buyers dominate the longer-term cost basis.
CHART PATTERNS
- Breakout from a consolidation or double top (reversal reference): Highs near $63 in March and about $66 in Aug–Sep acted as resistance. Price has cleared both and made new highs, which invalidates the bearish double-top reading. The measured move from the Sep–Oct base (about $59 to $66) projects roughly $73–75.
- Ascending staircase (continuation reference): The chart shows higher lows and higher highs in a steady channel, close to the "Bullish Flag / Ascending Triangle" continuation family. The target is the next leg up toward $73–76.
- Risk to the pattern: A rising-wedge-style exhaustion is possible given the weaker ADX, RSI and MACD peaks. It would be confirmed by a close back below about $66 and the EMA 50.
POTENTIAL SCENARIOS
- Scenario 1: Bullish Trend Continuation — The uptrend resumes after minor digestion near the upper band. CMF accumulation and the stacked moving averages carry price higher. Trigger: a daily close above the $71.05 Bollinger upper band with MACD holding above its signal. Target: $73.50–$77. Invalidation: a close below $64.99 (EMA 50 / SMA 50D). (50% probability)
- Scenario 2: Bearish Mean-Reversion Pullback — Overbought conditions, falling ADX and the mild divergences trigger a retracement toward the 50-day averages. Trigger: a MACD bearish cross and a close below $66. Target: $63–$65. Invalidation: a reclaim of $70 with rising volume. (32% probability)
- Scenario 3: Neutral Range Consolidation — Price chops between about $65 and $72 as weak ADX suggests. Trigger: repeated failures at the upper band without a break of $66. Target: $67–$71. Invalidation: a decisive break outside $64.50–$73. (18% probability)
PRICE TARGETS
- Target Price: $73.50 (97-day horizon, Feb 6, 2027)
- Expected Range: $62.50 to $79.00 (width $16.50, about 23.6% of the current price, consistent with the 18–30% guidance for 61–180 days)
- Key Levels: Support at $64.99 (EMA 50 / SMA 50D confluence), Resistance at $71.05 (Bollinger upper band, then about $75 on the measured move)
OVERALL BIAS
OVERALL BIAS: BULLISH - Price is above all key moving averages with a long-established golden cross, positive MACD, +DI above −DI and strong CMF accumulation at 0.208, and it has broken above prior resistance to new highs. The weak ADX and the overbought RSI near the upper Bollinger band temper conviction and make a pullback toward $65 a real risk.
This is educational analysis and not financial advice.