TLT 97-day bullish forecast — Nov 1, 2026
- Bias: Bullish
- Timeframe: 97 days (made Nov 1, 2026, target date Feb 5, 2027)
- Price at analysis: $81.84
- Price target: $84.50
- Expected range: $74.50 – $91.00
- Result: Pending — graded after the close on Feb 5, 2027
Get a free AI analysis of TLT today
Analysis
TECHNICAL INDICATORS
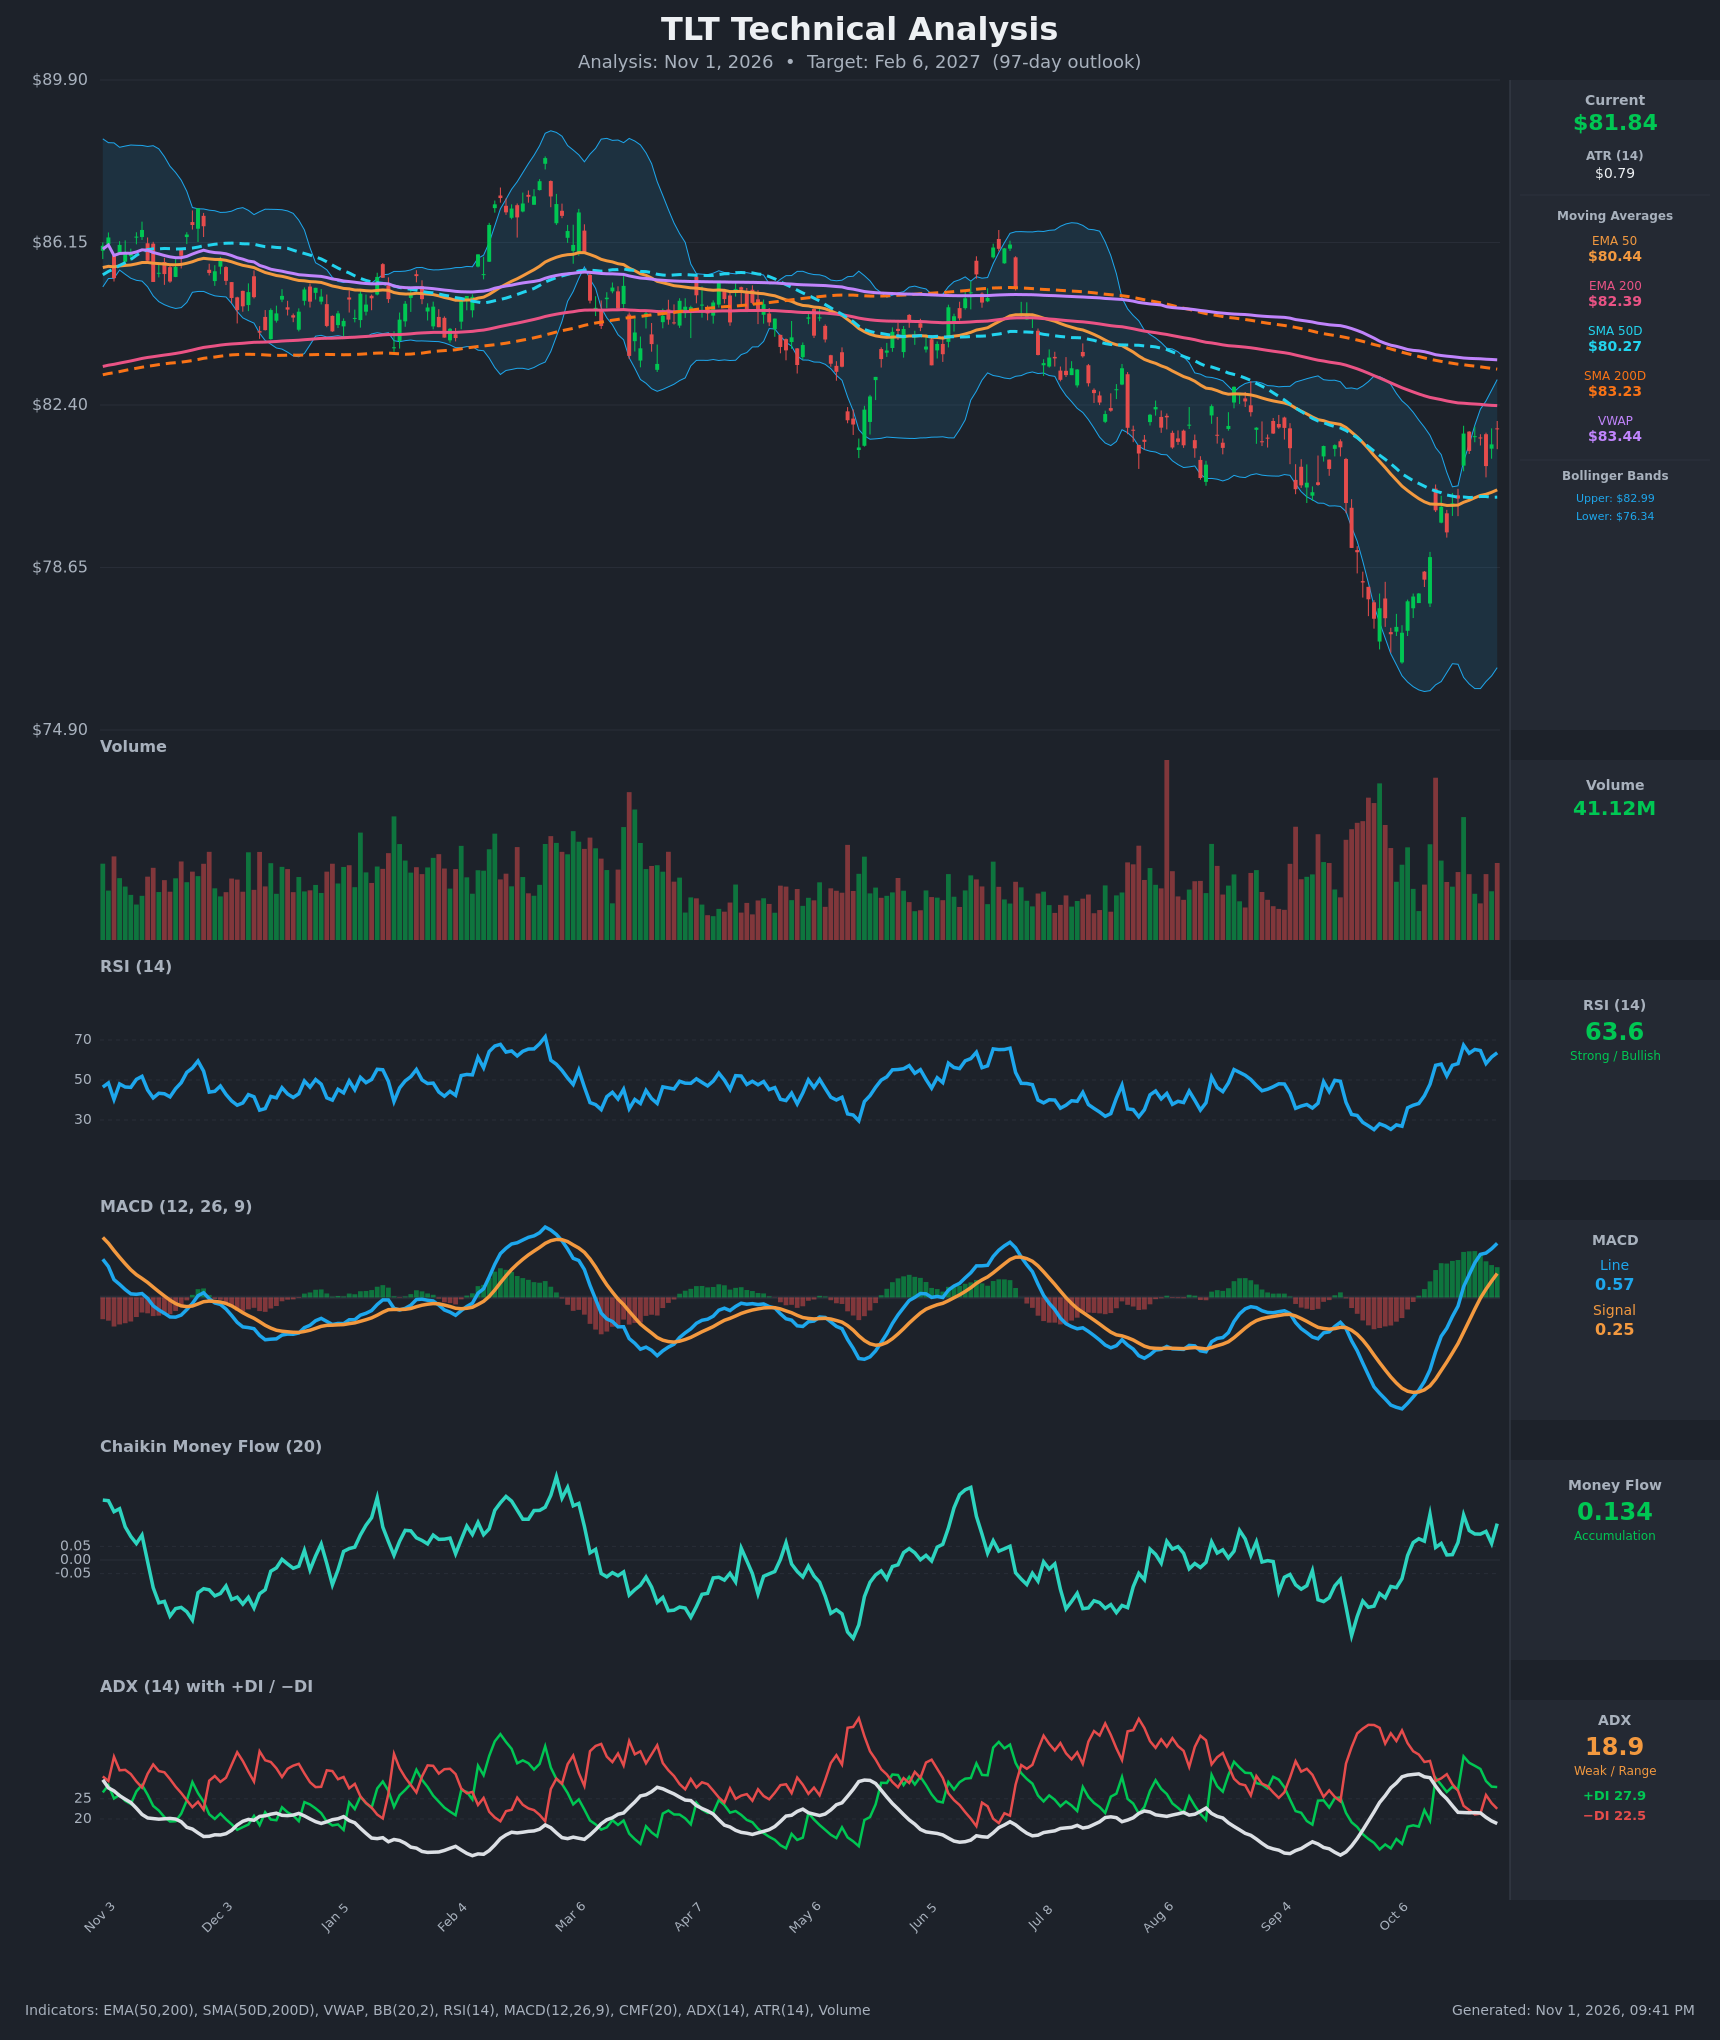
- RSI (14): 63.63, up from a trough near 27-28 in early October. It has recovered through 50 and peaked around 67 on Oct 22, and is now holding in the 58-65 zone without being overbought. [Bullish]
- 20 EMA: Not supplied. Using the 50 EMA instead, price at $81.84 is above the EMA 50 ($80.44) and SMA 50D ($80.27), which now act as support. Price is still below the EMA 200 ($82.39), so that is the first overhead resistance. [Bullish]
- MACD: Line 0.571 is above signal 0.252 and above zero. It crossed above the signal around Oct 15 and above zero on Oct 22. The histogram is positive at about +0.32 and has been expanding for two weeks, though the last few bars show it flattening. [Bullish]
- Bollinger Bands (20): Upper $82.99, lower $76.34, midline about $79.66. Price is in the upper half of the bands, about $1.15 below the upper band. The bands are still wide after the September-October selloff, and price has walked back up from the lower band. The $82.99 upper band sits next to the EMA 200 and SMA 200 cluster. [Bullish]
- CMF (20): +0.134, above the +0.05 threshold and positive for most of the last 15 bars. This shows steady accumulation behind the bounce. [Accumulation]
- ADX (14): 18.9, falling from 31 on Oct 12, so the prior downtrend has lost strength and there is no strong trend yet. +DI (27.9) is above −DI (22.5), and +DI has led since Oct 21 after a brief crossover on Oct 15. Control has shifted to the bulls, but with low conviction. [Weak Trend, Bullish lean]
- Volume: 41.12M, which is modest. The heaviest volume came during the October capitulation lows, and the rebound has come on lighter volume. That is normal for a relief rally, but it does not yet confirm a durable reversal. [Neutral / mildly supportive]
DIVERGENCES & TRENDS
- Long-term structure: The one-year trend is still down, with lower highs from the February peak near $87 through June. SMA 50D ($80.27) is below SMA 200D ($83.23), and EMA 50 ($80.44) is below EMA 200 ($82.39). Both are bearish structures with no golden cross, and the long averages are still sloping down.
- Price vs. MAs: Price is above EMA 50 and SMA 50 but below EMA 200, SMA 200 and VWAP ($83.44). That puts it in a transition zone, with resistance stacked between $82.39 and $83.44.
- Momentum: RSI and MACD both made a sharp V-shaped recovery from deeply oversold or negative readings. This is a momentum reversal, not a classic divergence, because price made a lower low at about $76 and RSI's low was similar to its May low.
- Trend strength: ADX has fallen from above 30 to under 19, which means the selling trend has exhausted. +DI is above −DI, so the early bias favors bulls, but there is no confirmed trend.
- Money flow: CMF is firmly positive, so buyers have been accumulating through the bounce.
- Crossovers: The MACD bullish cross and zero-line break are confirmed. The +DI/−DI flip is recent. Price reclaimed the 50-day averages in mid-October.
CHART PATTERNS
- Bullish Falling Wedge / reversal attempt: The lower highs and lower lows from July into October, ending in a capitulation low near $76 and a sharp bounce, resemble a falling wedge resolving upward. The measured target is a retracement to the wedge's origin, around $84-86, with $86-87 as an extended objective near the prior swing highs.
- Overhead resistance cluster: The $82.39-$83.44 zone (EMA 200, SMA 200, VWAP, upper Bollinger Band) is the main obstacle. A sustained close above it would confirm the reversal. Rejection there would resemble a bearish continuation, the dead-cat-bounce variant of the downtrend.
- Not present: There is no confirmed golden cross, and the ADX does not yet show a strong trend.
POTENTIAL SCENARIOS
- Scenario 1: Bullish Reclaim of the 200-Day Cluster — The momentum reversal continues, price clears the $82.39-$83.44 resistance zone, and TLT rotates back toward the upper end of its prior range. Trigger: daily close above $83.45 (VWAP and SMA 200) with MACD staying above zero. Target: $84.50, then $86.00-$87.00. Invalidation: close below $80.27 (SMA 50). (48% probability)
- Scenario 2: Bearish Failed Rally — The bounce stalls at the overhead moving averages, price rolls over, and the longer-term downtrend resumes. Trigger: rejection at $82.4-$83.4 with the MACD histogram turning negative and a break below $80.27. Target: $77.00-$76.30 (lower Bollinger Band and the October low), possibly $75. Invalidation: close above $83.50. (32% probability)
- Scenario 3: Neutral Range Consolidation — With ADX weak, price chops between the 50-day averages and the 200-day cluster. Trigger: repeated failures at $83 and holds at $80. Target: $80.00-$83.00. Invalidation: a decisive close outside the range in either direction. (20% probability)
PRICE TARGETS
- Target Price: $84.50 (97 days)
- Expected Range: $74.50 to $91.00 (width $16.50, about 20% of the current price, in line with the 61-180 day guidance)
- Key Levels: Support at $80.44, Resistance at $82.39
OVERALL BIAS
OVERALL BIAS: BULLISH - MACD is above signal and zero, RSI has recovered to the low 60s, CMF shows accumulation, +DI leads −DI, and price has reclaimed the 50-day averages after a capitulation low. The main risks are the stacked $82.4-$83.4 resistance, the lingering death-cross structure, and weak ADX, so conviction is modest.
This is educational analysis and not financial advice.