TSLA 97-day bullish forecast — Nov 1, 2026
- Bias: Bullish
- Timeframe: 97 days (made Nov 1, 2026, target date Feb 5, 2027)
- Price at analysis: $399.81
- Price target: $425.00
- Expected range: $355.00 – $455.00
- Result: Pending — graded after the close on Feb 5, 2027
Get a free AI analysis of TSLA today
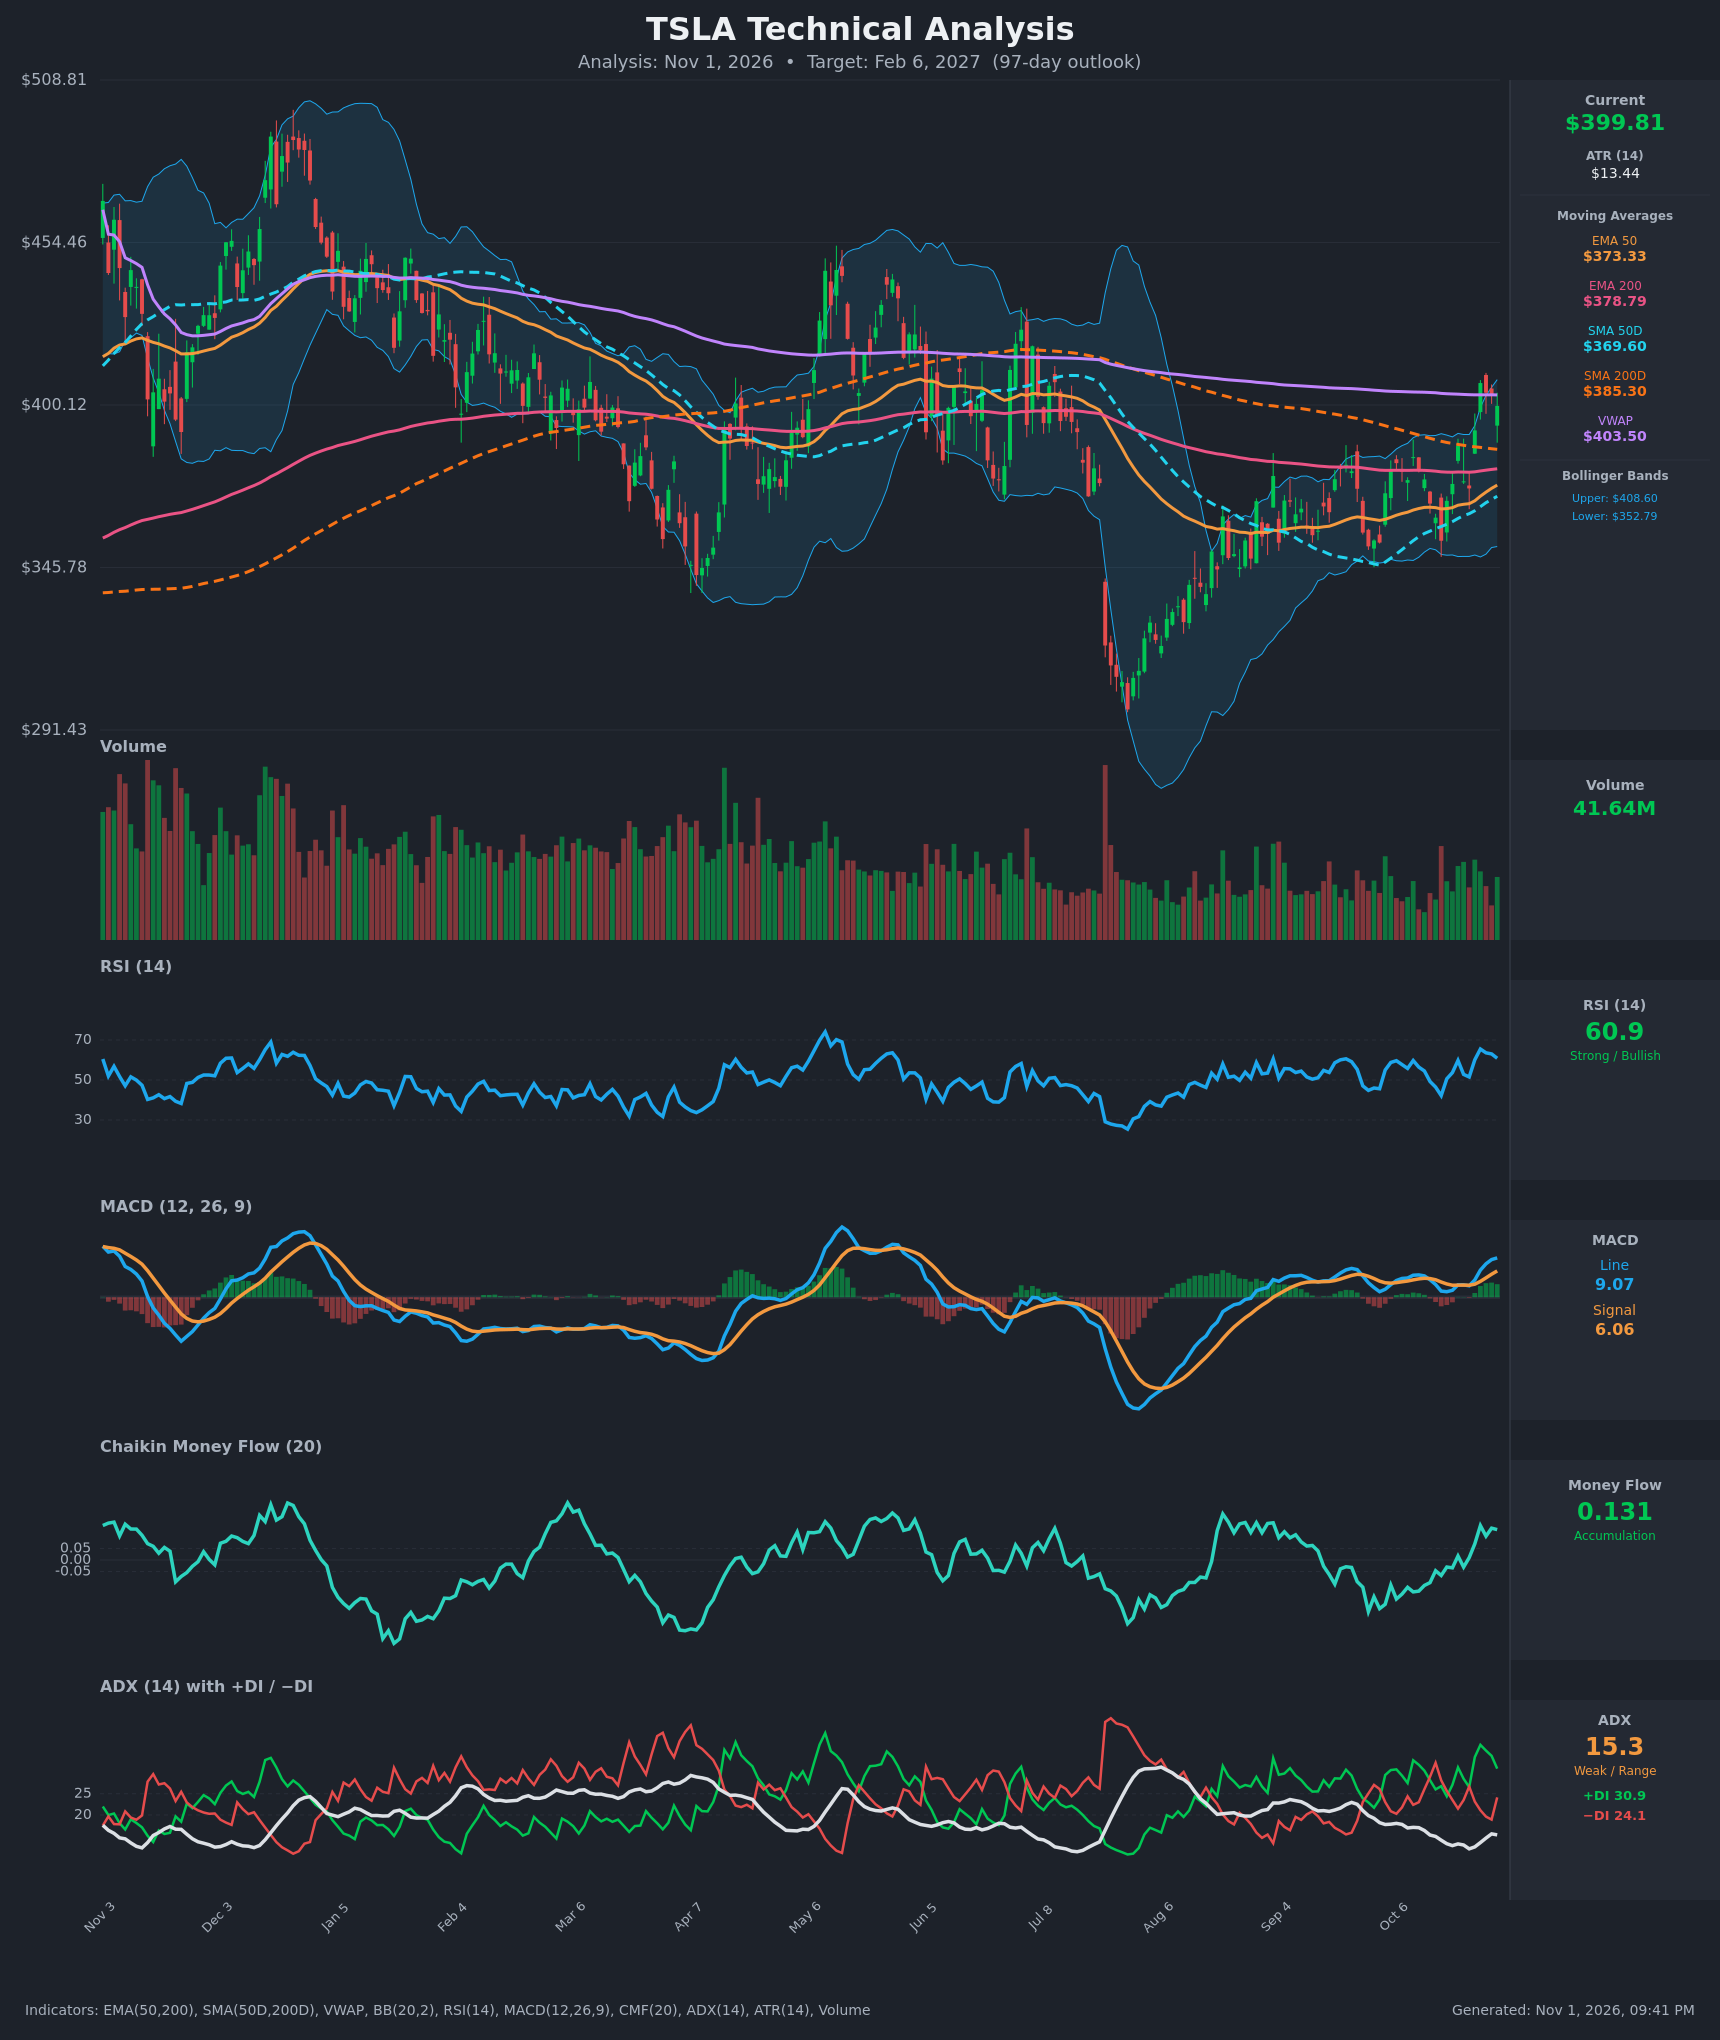
Analysis
TECHNICAL INDICATORS
- RSI (14): 60.86, up from 42.2 on Oct 16 and just below the 65.5 peak on Oct 27. Momentum is firmly positive but not overbought. [Bullish]
- 20 EMA: Not supplied. The 50 EMA ($373.33) and 200 EMA ($378.79) are the reference points. Price at $399.81 is above both, and the 50 EMA is rising toward the 200 EMA with a gap of about $5.50. [Bullish]
- MACD: Line 9.07 is above signal 6.06, and the histogram is positive (about +3.0) and widening. The line crossed above the signal around Oct 21–26 and has accelerated since. [Bullish]
- Bollinger Bands (20): Upper $408.60, lower $352.79, midline about $380.70. Price is in the upper quarter of the bands, about $9 below the upper band. The bands are moderately wide after the recent surge. A close above the upper band would show strength, while a stall here could mean a pullback to the midline. [Bullish]
- CMF (20): +0.131, well above the +0.05 threshold. It has risen from -0.135 on Oct 12 to a sustained positive reading, so buyers are active on the breakout. [Accumulation]
- ADX (14): 15.3 is below 20, so the trend is weak or range-bound, but +DI (30.9) is above −DI (24.1) and bulls have control. The ADX is flat to slightly rising off a low base. This is the main caution: the breakout lacks trend confirmation. [Weak Trend, bullish lean]
- Volume: 41.64M, about average to slightly below average compared with the prior year. The Oct 26–27 breakout candles had green volume, but participation is not exceptional. [Neutral to mildly supportive]
Moving-average and VWAP context:
- Price is above the SMA50D ($369.60), EMA50, EMA200 and SMA200D ($385.30), so it has reclaimed the long-term trend line.
- Price is still slightly below VWAP ($403.50), which is immediate overhead resistance.
- The SMA50D (rising) is still below the SMA200D, so no golden cross has occurred yet. The gap is about $15.70 and narrowing.
- The EMA50 is below the EMA200 by about $5.50 and converging, so a bullish EMA crossover could occur within weeks.
DIVERGENCES & TRENDS
- There is no clear price/RSI divergence. RSI made higher lows through the Sep–Oct base while price made higher lows, so the two are confirming.
- MACD has gone from a flat, sub-zero-ish drift in September to a clear bullish expansion, and the line is at its highest since the summer.
- CMF flipped from negative to positive and is making higher highs alongside price. That is positive confirmation.
- The DI lines reversed on Oct 20–21: +DI crossed back above −DI. The ADX itself stayed under 20, so this is early-stage, unconfirmed trend behavior.
- The Oct 30 candle pulled back from the Oct 27 high of $407.46 into VWAP and the upper band, and −DI ticked up from 18.9 to 24.1. This is a minor sign of near-term fatigue.
- Longer term, the Aug low near $300 to the current price is a sizeable V-shaped recovery, but the Dec peak near $490–500 and the $454 zone remain well above.
CHART PATTERNS
- Ascending Triangle (continuation or breakout): From September to October, price held a flat resistance around $385–390 with rising lows from about $340 to $355. The Oct 26–27 surge broke that ceiling. The measured move (triangle height about $45 added to the $390 breakout) gives roughly $435.
- Bullish Double Bottom / base: The Aug low near $300 and the retest in the mid-$340s in late Sep form a broad base. A neckline retest near $385–390 now acts as support.
- Overhead resistance zones: VWAP and the recent high at $403–408, then the $430–455 zone, which was a prior supply area from the spring and the early-year decline.
- A failure would resemble a bull trap, with price falling back into the $350–390 range.
POTENTIAL SCENARIOS
- Scenario 1: Bullish Breakout Continuation — Price holds the former $385–390 resistance as support, clears VWAP and the $408 band and high, and trends toward the measured-move target. The positive MACD, CMF accumulation and +DI lead support this. Trigger: daily close above $408.60 on rising volume. Target: $425–$440, with an extension to about $455. Invalidation: daily close below $378 (EMA200 / neckline). (50% probability)
- Scenario 2: Neutral Range-Bound Consolidation — The weak ADX (15.3) keeps price churning between the SMA200D area and VWAP/upper band, the same choppy behavior seen for much of the past year. Trigger: failure to close above $408 and repeated rejections at VWAP. Target: $375–$410. Invalidation: close above $415 or below $365. (20% probability)
- Scenario 3: Bearish Failed Breakout — The rally proves a bull trap at VWAP and the declining long-term resistance. Price falls back below the 200-day averages and retests the lower Bollinger Band area. Trigger: close below $385 with −DI crossing above +DI. Target: $352–$365. Invalidation: reclaim of $408 on strong volume. (30% probability)
PRICE TARGETS
- Target Price: $425.00 (97-day horizon, about +6.3%)
- Expected Range: $355.00 to $455.00 (width $100, about 25% of the current price, consistent with the 61–180 day guidance)
- Key Levels: Support at $385.30 (SMA200D, with the former breakout zone), Resistance at $408.60 (upper Bollinger Band / Oct 27 swing high)
OVERALL BIAS
OVERALL BIAS: BULLISH - Price has reclaimed all major moving averages, with a bullish MACD, positive CMF accumulation, +DI over −DI and a breakout from a rising-lows base. The weak ADX and the VWAP/upper-band overhead resistance limit conviction, so the upside is moderate rather than aggressive.
This is educational analysis and not financial advice.