WMT 97-day bullish forecast — Nov 1, 2026
- Bias: Bullish
- Timeframe: 97 days (made Nov 1, 2026, target date Feb 5, 2027)
- Price at analysis: $123.51
- Price target: $127.50
- Expected range: $112.50 – $139.00
- Result: Pending — graded after the close on Feb 5, 2027
Get a free AI analysis of WMT today
Analysis
TECHNICAL INDICATORS
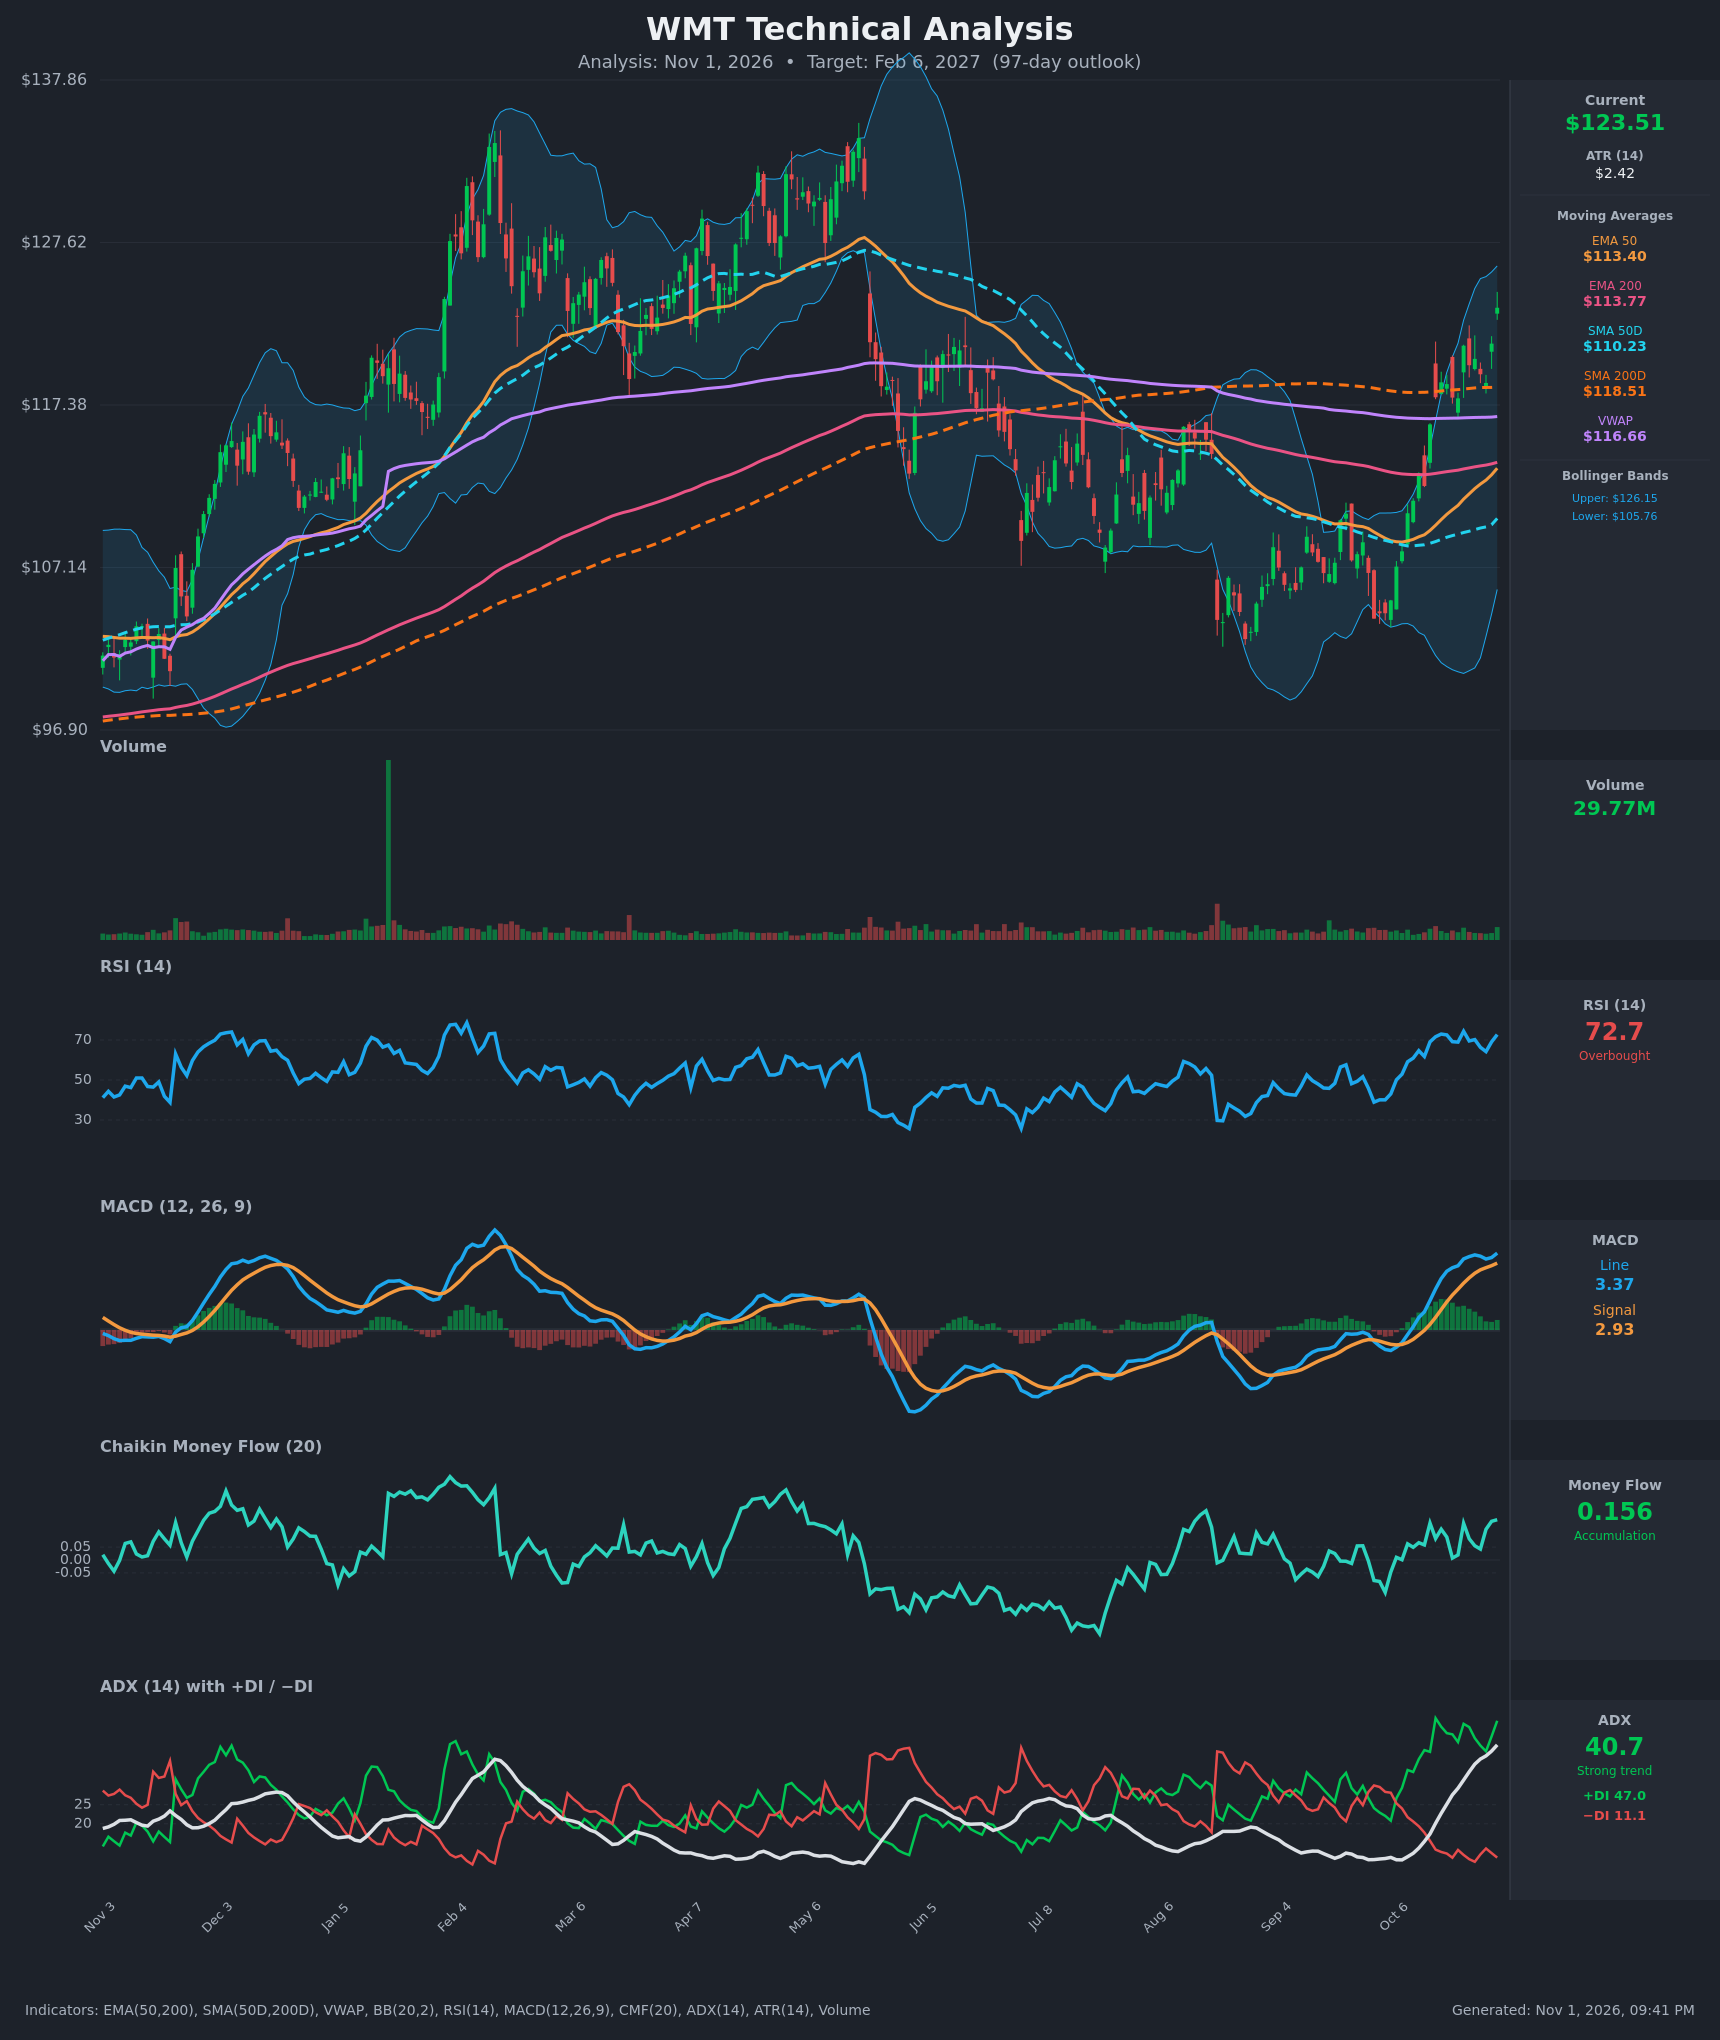
- RSI (14): 72.7, in overbought territory and back above 70 after dipping to 64 on Oct 28. Momentum has trended up since the 61.7 reading on Oct 13. Strong trends can hold RSI above 70 for weeks, but the short-term pullback risk is higher. [Bullish]
- 20 EMA: The 20 EMA isn't supplied. The nearest references are the EMA 50 at $113.40 and the EMA 200 at $113.77, with price about 8.9% above both. The EMA 50 has risen from $109.08 to $113.40 in 15 bars and is about to cross above the EMA 200 (a gap of only $0.37). That would be a bullish EMA golden cross. [Bullish]
- MACD: The line at 3.365 is above the signal at 2.926, and both are positive. The histogram is positive and widening again after a brief flattening on Oct 27-28. This is a bullish crossover that has held since Oct 13. [Bullish]
- Bollinger Bands (20): The bands are $105.76 to $126.15. Price at $123.51 is in the upper part of the bands, about $2.64 below the upper band. The bands are widening after the squeeze at the lows, which marks a volatility expansion to the upside. Price is riding the upper half, not yet stretched past the band. [Bullish]
- CMF (20): 0.156 is well above +0.05 and has been positive throughout the rally (0.04 to 0.16). That shows steady accumulation, not a one-day spike. [Accumulation]
- ADX (14): 40.7 and rising sharply (from 13.6 on Oct 12), with +DI at 47.0 far above −DI at 11.1. This is a strong, mature uptrend with bulls in full control. An ADX above 40 can also signal some trend exhaustion, so a pause is possible. [Strong Trend - Bullish]
- Volume: 29.77M is moderate and green on the latest bar, with no capitulation or blow-off spike. The rally has had decent participation, though it is not as heavy as the huge early-year surge. VWAP at $116.66 is well below price, so buyers are in profit and in control. [Mildly Bullish / confirming]
DIVERGENCES & TRENDS
- There is no bearish RSI or MACD divergence. RSI and MACD are making higher highs along with price, so momentum confirms the move.
- Price has reclaimed the SMA200D ($118.51) and sits above all major averages: EMA 50, EMA 200, SMA 50D and VWAP. That is a structural shift from the Aug-Oct downtrend.
- The SMA 50D ($110.23) is still below the SMA 200D ($118.51). A golden cross is not yet in place, but the gap is narrowing. The EMA 50 / EMA 200 crossover is the nearer signal.
- ADX has swung from the ~13 range-bound zone to above 40 in 15 bars, with +DI dominant. This is a classic trend-initiation sequence.
- The main caution is RSI above 70 together with price near the upper band. That raises the odds of a pullback or consolidation toward $118-$121, the prior breakout zone, before any continuation.
CHART PATTERNS
- Bullish Double Bottom: The lows in Aug and Oct are around $101-$104, with a neckline near $118-$120 (the SMA200D region). Price has broken above that neckline. The measured move is neckline ~$118.5 plus the pattern depth of ~$16-17, which gives about $134-$135. That is close to the prior swing highs of $133-$134 from Feb-May.
- Reversal from a falling-wedge-style decline (Bullish Falling Wedge): The decline from the May peak into October compressed and then broke upward. This supports the reversal.
- Resistance: The $127-$128 zone is the former consolidation area, and the $133-$134 highs are the major overhead level.
POTENTIAL SCENARIOS
- Scenario 1: Bullish Trend Continuation / Double Bottom Measured Move — The breakout above the SMA200D holds. Any pullback is shallow and buyers defend the $118-$121 zone, then price pushes through $128 toward the prior highs. Trigger: a daily close above $126.15 (upper band) with CMF staying above 0.05 and the EMA 50 crossing above the EMA 200. Target: $127.50 to $134. Invalidation: a daily close below $118.50. (55% probability)
- Scenario 2: Bearish Overbought Mean-Reversion — RSI above 70 and price at the upper band trigger profit-taking. The breakout above the SMA200D fails, and price falls back into the Aug-Oct range. Trigger: a bearish MACD crossover and a close below the $118.50 SMA200D. Target: $113-$114 (EMA 50 / EMA 200 zone), then $110. Invalidation: a reclaim of $124-$126 on strong volume. (25% probability)
- Scenario 3: Neutral Consolidation — The ADX peak leads to a digestion phase, with price ranging between ~$118 and ~$128 while the moving averages catch up. Trigger: ADX rolling over from above 40 while RSI cools to 50-55. Target: $120-$127 range. Invalidation: a break outside $116-$130. (20% probability)
PRICE TARGETS
For the 97-day horizon (target date about Feb 6, 2027):
- Target Price: $127.50
- Expected Range: $112.50 to $139.00. This is $26.50 wide, or 21.5% of the current price, which is within the 18-30% guidance for 61-180 days.
- Key Levels: Support at $118.51 (SMA200D and breakout neckline), Resistance at $133.50 (prior swing highs). Intermediate resistance sits at $126.15 (upper Bollinger Band) and $128.
OVERALL BIAS
OVERALL BIAS: BULLISH - The price has broken above the SMA200D with ADX at 40.7 and +DI far above −DI. MACD is bullish, CMF shows accumulation, and the double-bottom breakout points to roughly $134. The overbought RSI argues for a possible pullback to $118-$121 along the way.
This is educational analysis and not financial advice.