QQQ 46-day bearish forecast — Nov 2, 2026
- Bias: Bearish
- Timeframe: 46 days (made Nov 2, 2026, target date Dec 18, 2026)
- Price at analysis: $695.99
- Price target: $676.00
- Expected range: $630.00 – $735.00
- Result: Pending — graded after the close on Dec 18, 2026
Get a free AI analysis of QQQ today
Analysis
TECHNICAL INDICATORS
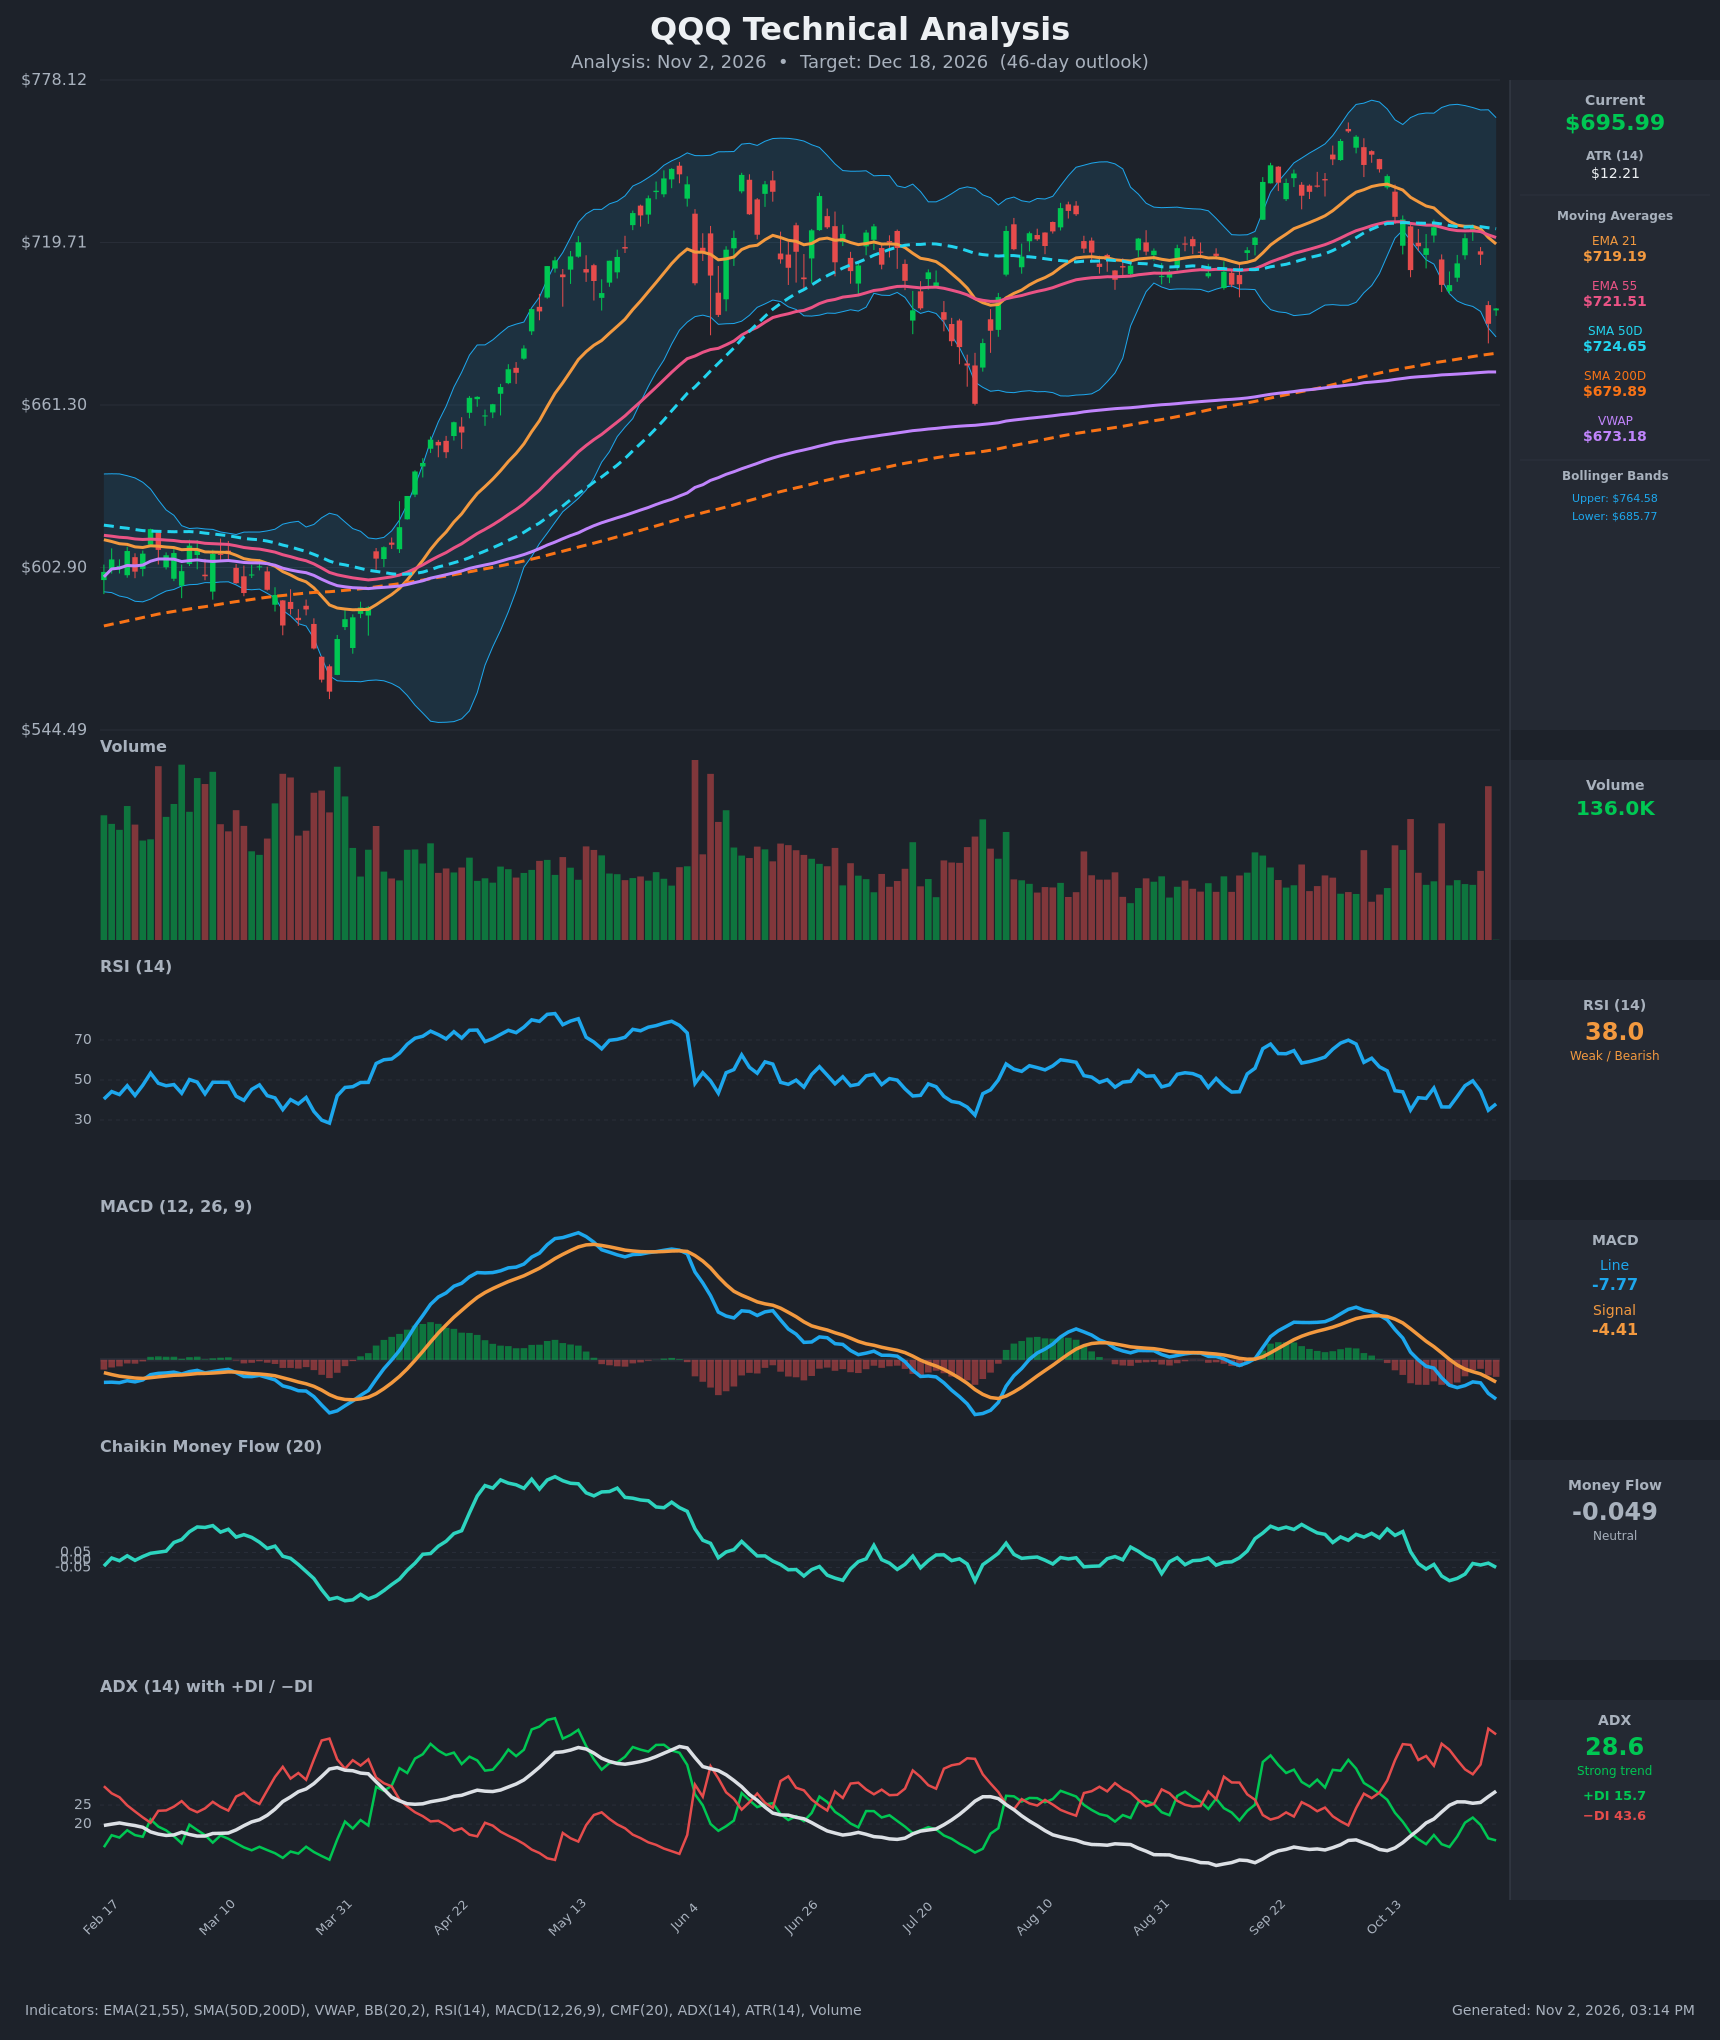
- RSI (14): 38.05, below the 50 midline and close to oversold (30). It bounced from 34.9 on Oct 30 but has made lower highs since the 69 peak in late September, so momentum is weak with some room before it hits oversold. [Bearish]
- 20 EMA: The EMA 21 is $719.19 and price at $695.99 is about 3.2% below it. The EMA 21 has crossed below the EMA 55 ($721.51), a bearish crossover, and the cluster at $719-$725 is now overhead resistance. [Bearish]
- MACD: The line is -7.77 against a signal of -4.41, below zero and below its signal since mid-October. The histogram is negative and widening, so bearish momentum is still building. [Bearish]
- Bollinger Bands (20): Price is $695.99 against a lower band of $685.77 and an upper band of $764.58. It sits in the lower quarter of the bands, about $10 above the lower band. The bands are wide and the midline is around $725. A walk along the lower band is possible, and a touch of it would likely bring a bounce. [Bearish]
- CMF (20): -0.049, just inside the neutral band but down from +0.206 on Oct 13. The trend has turned from accumulation to mild distribution, and it is hovering at the -0.05 threshold. [Neutral]
- ADX (14): 28.6 and rising, with −DI at 43.6 far above +DI at 15.7. That is a strong trend, and the bears are clearly in control. [Strong Trend – Bearish]
- Volume: The latest reading is 136.0K, and the most recent red candle on the chart carries one of the largest volume bars of the recent period. That suggests active selling on the drop, though a heavy-volume low can sometimes mark short-term capitulation. [Bearish – Distribution]
DIVERGENCES & TRENDS
- No clear bullish divergence yet. RSI at 38 is above its mid-October low of 35, but price has made a lower low, and that is not enough to count as divergence.
- Price is stair-stepping lower, with lower highs ($743 → $725 → $715) and lower lows ($690), and all indicators confirm the move.
- The EMA 21 crossed below the EMA 55 on Oct 30, and both are rolling over. The SMA50D is also starting to curl down at $724.65.
- There is no death cross. The SMA50D ($724.65) remains well above the SMA200D ($679.89), but that gap is the buffer being tested.
- Price is below the VWAP-implied support zone only marginally: it is above the VWAP ($673.18) and the SMA200D ($679.89), the last major supports.
- MACD crossed below its signal in mid-October and below zero on Oct 19. The −DI crossover and ADX above 25 reinforce the downtrend.
- CMF has rolled over from +0.2 to about -0.05, so buying pressure has faded.
CHART PATTERNS
- Bearish Double Top / lower-high structure: Peaks around the $745-$760 area in late September and early October, followed by a lower high near $725, form a topping structure. The neckline sits near $690-$704, and price has now broken to or through it. The measured move from a ~$55-$60 pattern height points to about $635-$645, though the SMA200D and the $661 prior swing low are likely to slow it.
- There is a mild bearish flag / lower-highs channel since mid-October, with a rejection at the EMA cluster.
- A bullish counter-view, only if price reclaims $725, is a failed breakdown that traps shorts.
POTENTIAL SCENARIOS
- Scenario 1: Bearish Drift to the 200-Day — Price keeps trending lower under the EMA cluster and tests the SMA200D and the $661-$680 zone. Trigger: a close below $685 (the lower Bollinger Band) with MACD still falling. Target: $665-$680. Invalidation: a daily close above $725. (50% probability)
- Scenario 2: Bullish Oversold Bounce and Reclaim — The SMA200D holds and RSI turns up from the 30s, so price rebounds to retest the EMA 21/EMA 55/SMA50 confluence. Trigger: a bounce from $680-$690 with CMF moving above +0.05. Target: $719-$725. Invalidation: a break below $680. (30% probability)
- Scenario 3: Bearish Breakdown Below the 200-Day — Selling accelerates through the SMA200D, completing the double-top measured move. Trigger: a daily close below $679 on heavy volume. Target: $635-$661. Invalidation: a reclaim of $700 within a few sessions. (20% probability)
PRICE TARGETS
Timeframe: 46 days (Dec 18, 2026). The range width is $105, about 15.1% of the current price, in line with 30-60 day guidance.
- Target Price: $676.00
- Expected Range: $630.00 to $735.00
- Key Levels: Support at $679.89 (SMA200D), Resistance at $719.19 (EMA 21)
OVERALL BIAS
OVERALL BIAS: BEARISH - Price is below the EMA 21, EMA 55 and SMA50D after a bearish EMA crossover. MACD is negative, ADX is 28.6 with −DI (43.6) far above +DI (15.7), and CMF is fading, so a test of the SMA200D near $680 and possibly the low-$660s is the most likely path.
This is educational analysis and not financial advice.