QQQ 45-day bearish forecast — Nov 3, 2026
- Bias: Bearish
- Timeframe: 45 days (made Nov 3, 2026, target date Dec 18, 2026)
- Price at analysis: $685.16
- Price target: $670.00
- Expected range: $625.00 – $712.00
- Result: Pending — graded after the close on Dec 18, 2026
Get a free AI analysis of QQQ today
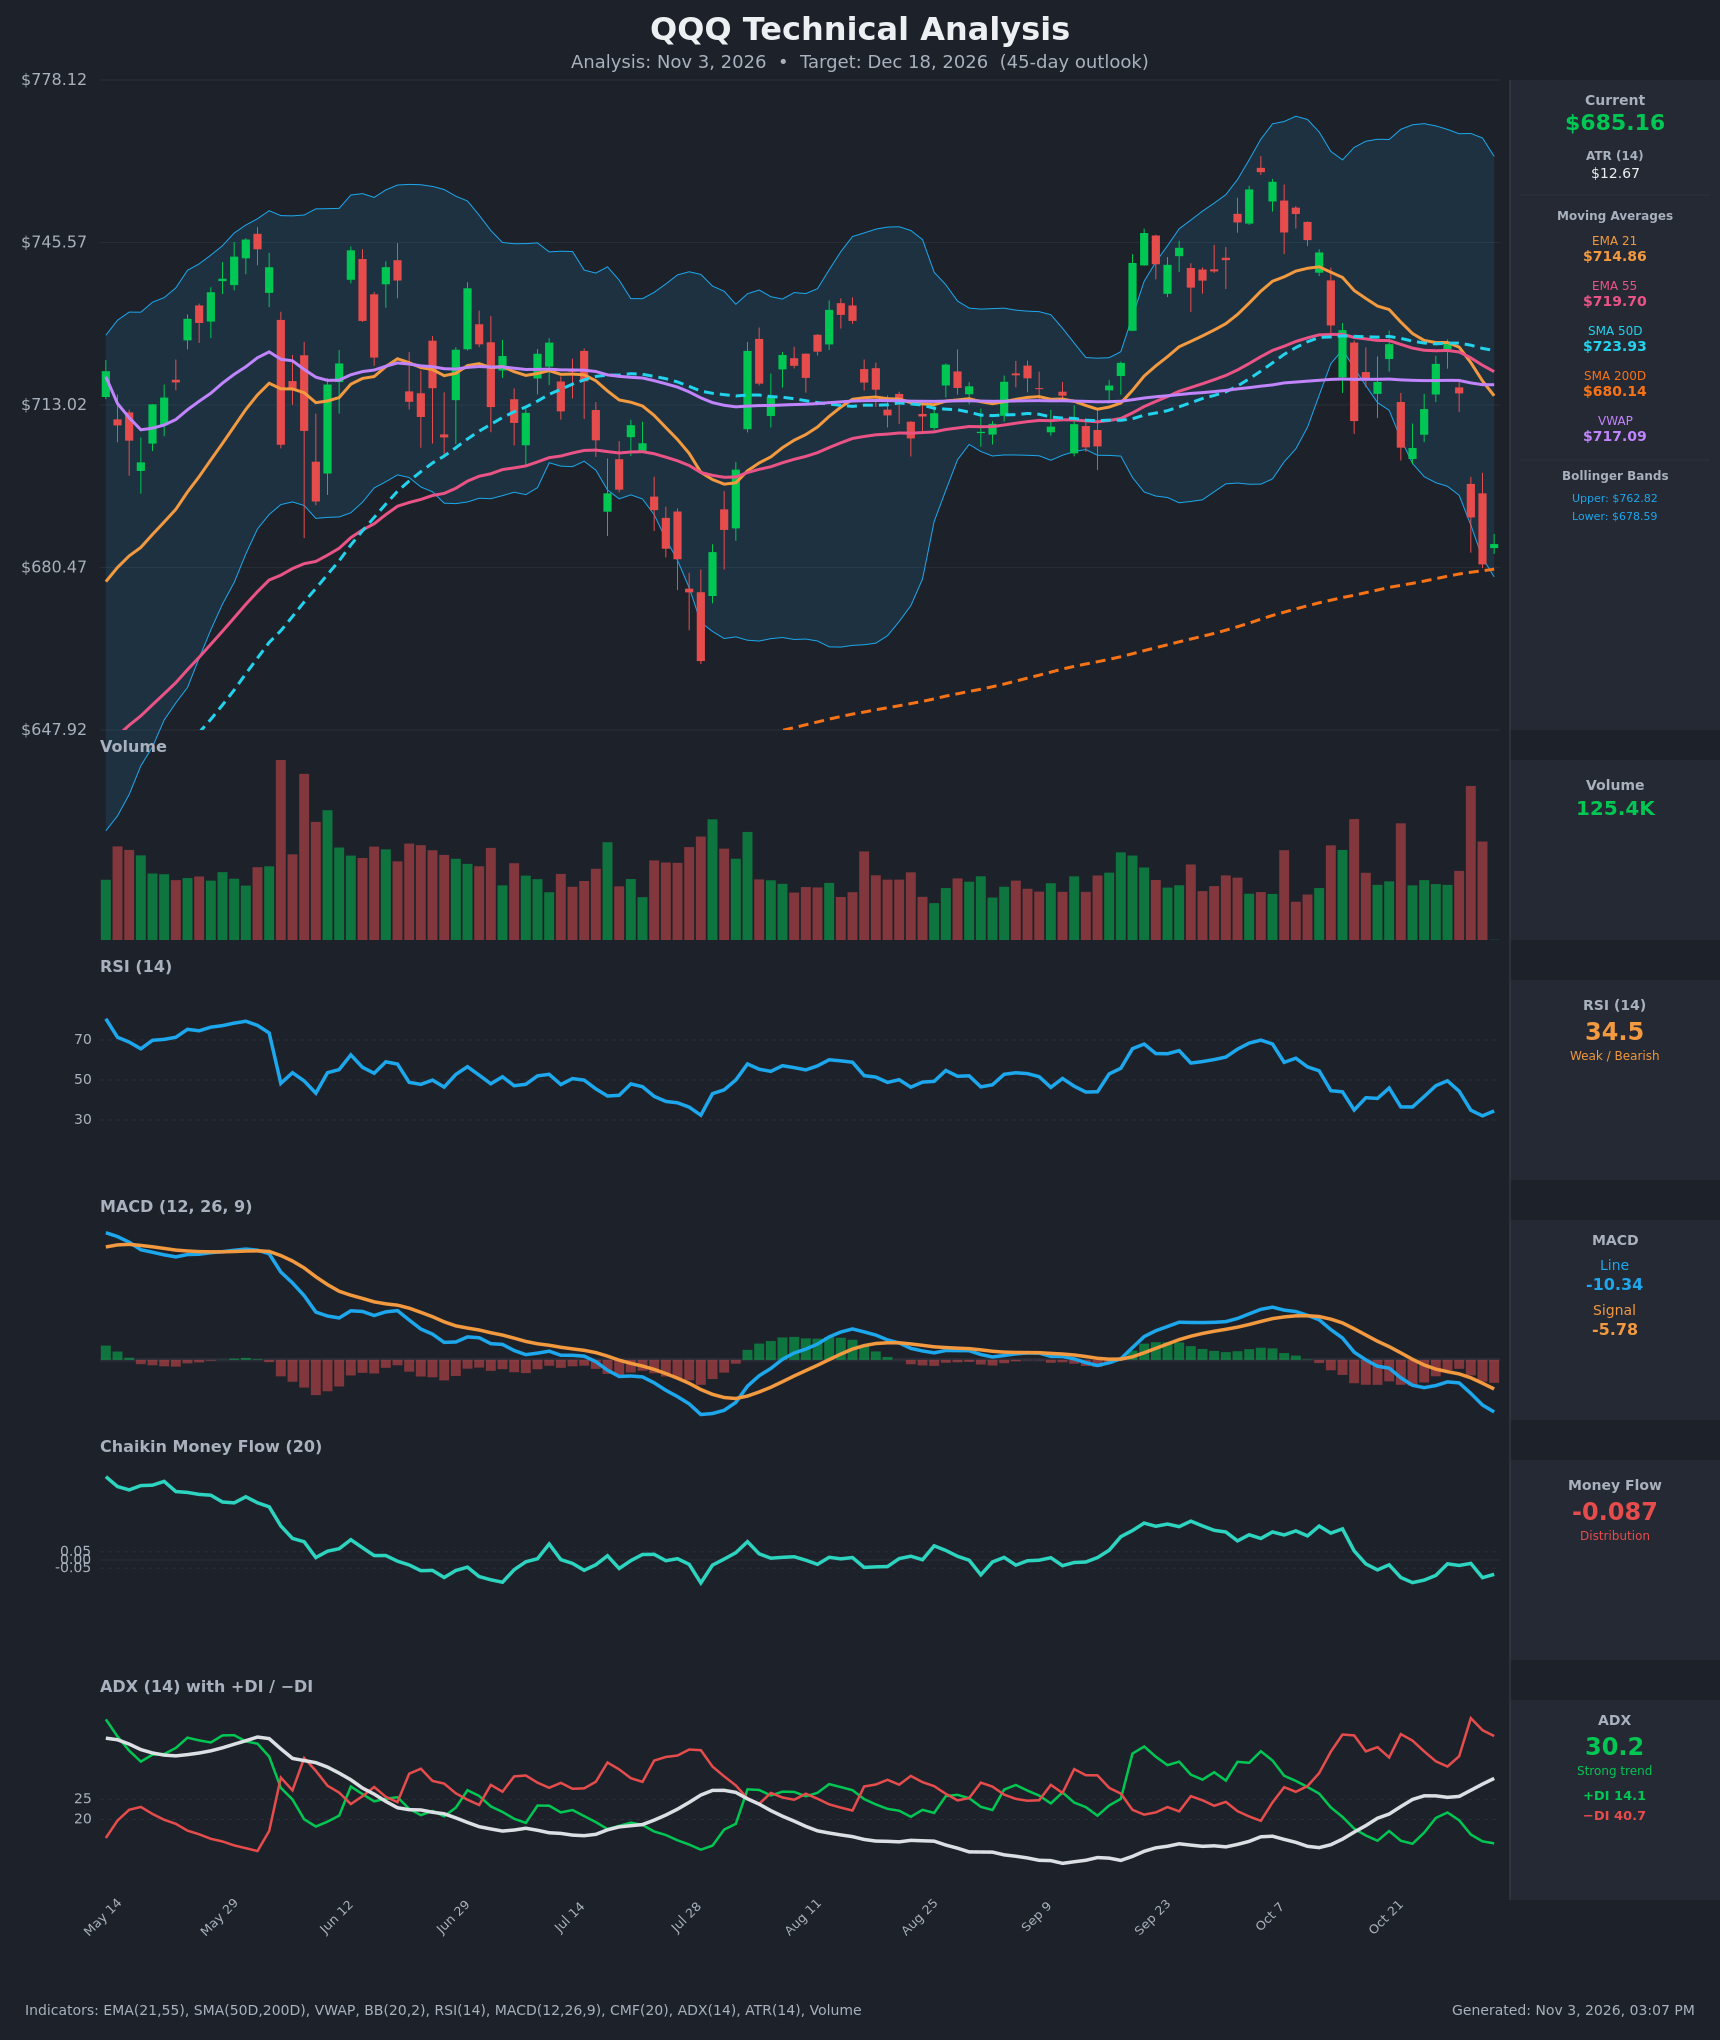
Analysis
TECHNICAL INDICATORS
- RSI (14): 34.53, down from 49.6 on Oct 28 and near the 30 oversold line. It is not yet oversold, and it shows no bullish divergence. Momentum is weak and still falling. [Bearish]
- 20 EMA: The 21 EMA is $714.86, about 4.3% above price at $685.16. It is sloping down steeply and acts as overhead resistance. It has also crossed below the EMA 55 ($719.70), a bearish crossover on Oct 30. [Bearish]
- MACD: The line is -10.34, below the signal at -5.78, and the gap is widening. The histogram is increasingly negative and the bearish crossover on Oct 19-23 has extended. There is no sign of a momentum turn. [Bearish]
- Bollinger Bands (20): The lower band is $678.59 and the upper is $762.82. Price is hugging the lower band, about $6.60 above it. The bands are wide, so volatility is elevated. A walk down the lower band is common in strong downtrends, but this is also a stretched area where a bounce can start. [Bearish]
- CMF (20): -0.087, below the -0.05 threshold. It has dropped from +0.19 in mid-October to sustained negative readings, which signals distribution. [Distribution]
- ADX (14): 30.2 and rising from 13.7. -DI is 40.7 and +DI is 14.1, so bears are firmly in control. This is a strong, accelerating downtrend. [Strong Trend – Bearish]
- Volume: 125.4K on the latest bar. Heavy red-volume bars on the Oct 30 and Nov 2 breakdown suggest selling conviction. The latest bar is a small bounce candle on lighter volume. [Bearish – selling pressure with weak bounce participation]
DIVERGENCES & TRENDS
- There is no bullish divergence. RSI (34.5) is falling alongside price. It is above the July 28 low of about 31 while price is above the July low of about $660, so nothing diverges.
- MACD is at its lowest level since July. The line and histogram are both deteriorating.
- The EMA21 crossed below the EMA55 on Oct 30. The SMA50D ($723.93) is rolling over toward flat and is still well above the SMA200D ($680.14). There is no death cross yet, but the gap is narrowing.
- Price is sitting right on the SMA200D ($680.14), the key long-term support. Price closed at $681.09 on Nov 2, just above it, so this is a decisive test.
- Price is below VWAP ($717.09), which indicates sellers are in control.
- The DI spread (-DI 40.7 vs +DI 14.1) and the rising ADX confirm a trend that is gaining strength.
CHART PATTERNS
- Bearish Head and Shoulders / Double Top (loose): The Sep–Oct peak near $760 sits above the earlier $745 swing high. Price has since broken the neckline zone near $700-$705 and the 50-day average. This is a reversal structure whose measured move points toward the $650 area.
- Lower highs and lower lows since Oct 7: This is a developing downtrend channel, with rallies capped by the EMA21 and EMA55.
- The SMA200D at about $680 is the immediate support. A close below it would confirm the breakdown, and the next support is the July low near $660, then about $648.
- The pattern is not a textbook match, so treat the targets as approximate.
POTENTIAL SCENARIOS
- Scenario 1: Bearish Breakdown Below the 200-Day — Price loses the SMA200D and the lower Bollinger Band, with ADX above 30 and -DI dominant. Trigger: daily close below $678. Target: $655-$660 (July low), with an extension to about $648. Invalidation: daily close back above $715 (EMA21). (50% probability)
- Scenario 2: Bullish Relief Bounce Off the 200-Day — RSI near oversold and the lower band trigger a mean-reversion bounce, but it stalls at the declining EMAs. Trigger: bullish reversal candle above $695 with RSI turning up. Target: $712-$720 (EMA21/VWAP). Invalidation: close below $675. (30% probability)
- Scenario 3: Neutral Chop Around the 200-Day — Price consolidates between $665 and $705 as the downtrend loses steam. Trigger: ADX rolls over below 25. Target: about $685. Invalidation: a close outside $660-$715. (20% probability)
PRICE TARGETS
- Target Price: $670.00 (45-day)
- Expected Range: $625.00 to $712.00 (width $87, about 12.7% of the current price, which fits the 30-60 day guidance)
- Key Levels: Support at $680.14 (SMA200D), with deeper support at $660 and $648. Resistance at $714.86 (EMA21), with nearer resistance around $719.70 (EMA55).
Note on the key levels: price ($685.16) is only $5 above the SMA200D, so $680.14 is the nearest support below. The nearest resistance is the EMA21 at $714.86.
OVERALL BIAS
OVERALL BIAS: BEARISH - ADX is 30.2 with -DI at 40.7 against +DI at 14.1, MACD is deepening below its signal, CMF shows distribution, and price is below all the short-term moving averages and VWAP. The main risk is a bounce off the 200-day average and the lower Bollinger Band, so the 45-day target of $670 reflects a moderate downside lean.
This is educational analysis and not financial advice.