XLE 45-day bearish forecast — Nov 3, 2026
- Bias: Bearish
- Timeframe: 45 days (made Nov 3, 2026, target date Dec 18, 2026)
- Price at analysis: $66.97
- Price target: $64.50
- Expected range: $59.50 – $70.00
- Result: Pending — graded after the close on Dec 18, 2026
Get a free AI analysis of XLE today
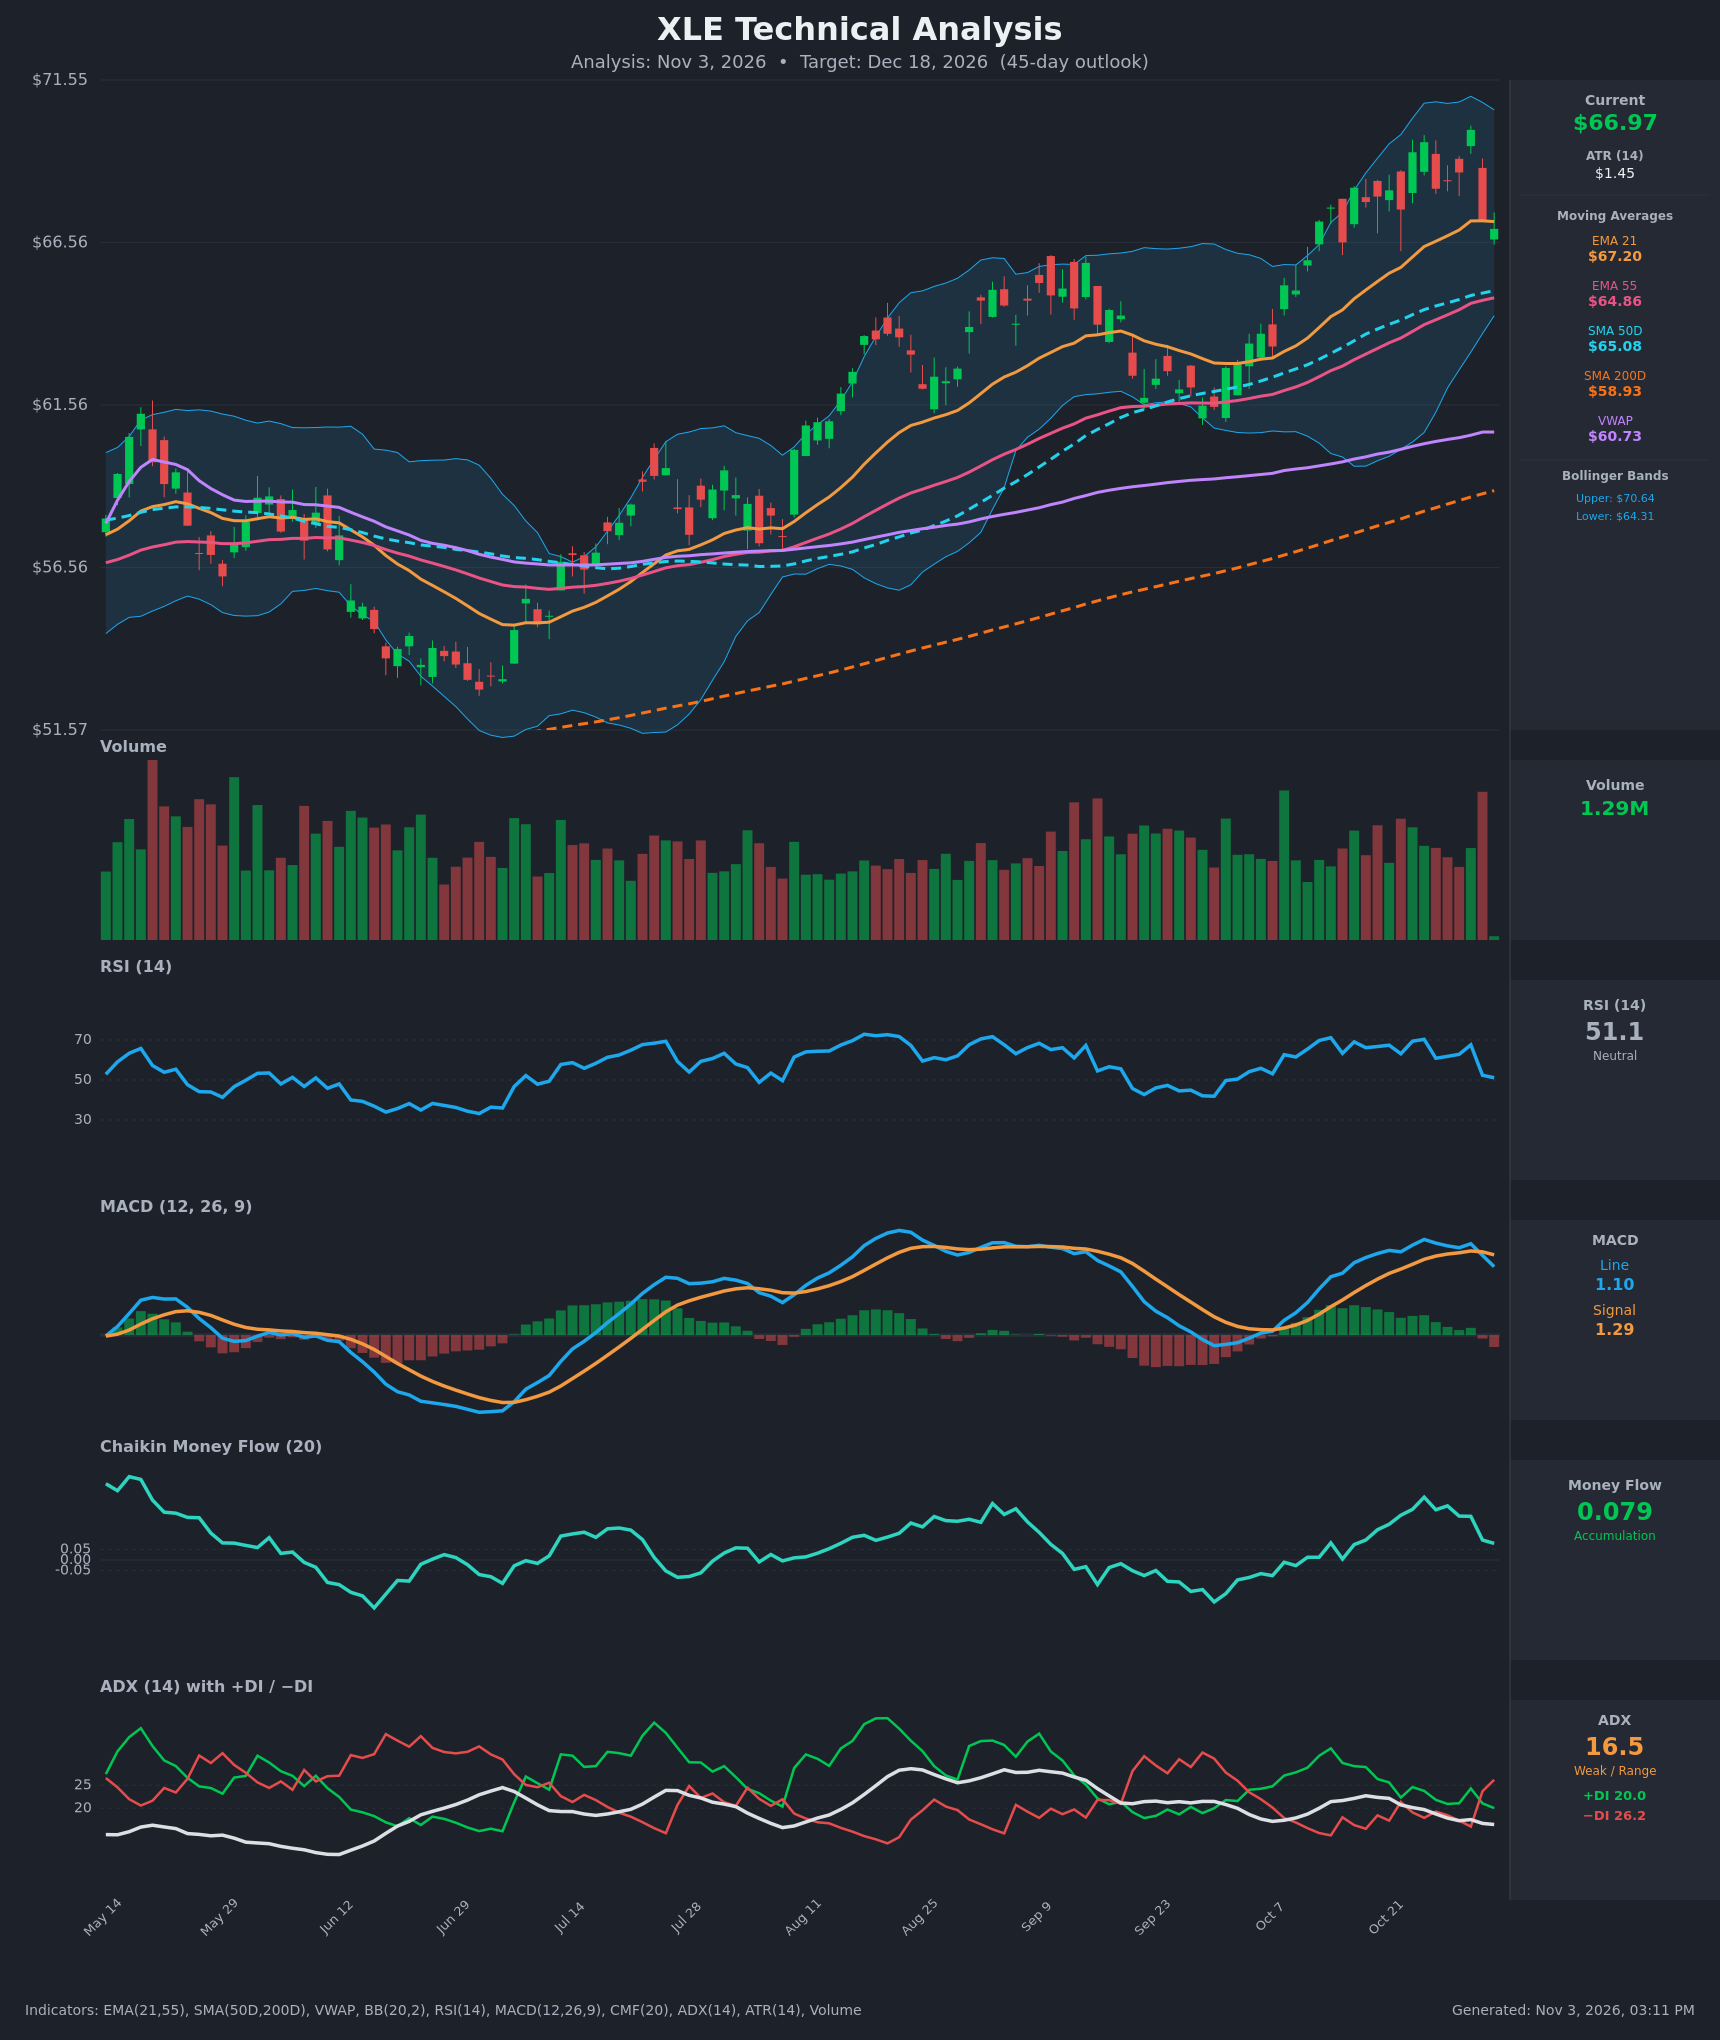
Analysis
TECHNICAL INDICATORS
- RSI (14): 51.14, down sharply from 67.6 on Oct 30 and 70.3 on Oct 26. It has fallen back to the midline, so momentum has faded quickly. It is not oversold, so there is room to fall further. [Bearish]
- 20 EMA (EMA 21): $67.20, and price at $66.98 has just closed below it for the first time since mid-October. The EMA is flat (67.22 → 67.20), so it now acts as near-term resistance. EMA 21 is still well above EMA 55 ($64.86), so the medium-term structure is intact. [Bearish]
- MACD: Line 1.103 vs Signal 1.295. The bearish crossover occurred on Nov 2 and the histogram has turned negative (about -0.19). The MACD line is rolling over from a peak of 1.543, and the signal line is starting to flatten. [Bearish]
- Bollinger Bands (20): Upper $70.64, lower $64.31, midline about $67.47. Price tagged the upper band area at $70.02 on Oct 30, was rejected, and has fallen back below the midline. Bands are wide, so volatility is elevated. The next band support is the lower band near $64.31, which sits close to the SMA50/EMA55 cluster. [Bearish]
- CMF (20): 0.079, still above +0.05, but it has fallen from a peak of 0.299 (Oct 26). Buying pressure is fading and the trend is lower, with the Nov 2 heavy-volume red candle the likely cause. [Neutral]
- ADX (14): 16.5, falling from 22 and below 20, so there is no real trend. −DI (26.2) has crossed above +DI (20.0), a bearish DI crossover. Directional control has shifted to sellers, but the weak ADX means follow-through is not guaranteed. [Weak Trend, bearish lean]
- Volume: 1.29M on the latest bar, which looks partial or light. The prior session had one of the heaviest red volume bars of the recent period (-4% reversal from $70.02 to $67.25). That is a distribution-style reversal on high volume. [Bearish]
Other levels:
- Price is above SMA50 ($65.08), EMA55 ($64.86), VWAP ($60.73) and SMA200D ($58.93), so the long-term uptrend is intact.
- SMA50 is far above SMA200, so the golden cross is long established and is not a new signal.
DIVERGENCES & TRENDS
- Momentum divergence: Price made a higher high at $70.02 on Oct 30, but RSI (67.6) and MACD (1.473) stayed below their Oct 26 peaks (70.3 and 1.543). This is a mild bearish divergence, followed by a sharp breakdown in RSI.
- CMF trend: CMF peaked on Oct 26 and has declined for about a week, confirming waning accumulation.
- Crossovers:
- MACD bearish cross (Nov 2).
- −DI over +DI (Nov 2).
- Price below EMA21 (Nov 3).
- Trend backdrop: Since July the stock has been in a rising channel (higher lows at about $61 in late Sep/Oct). ADX under 20 shows the latest rally lacked trend strength, making a corrective pullback toward the SMA50/EMA55 zone ($65) likely.
CHART PATTERNS
- Bearish Double Top (reference diagram): Peaks at about $69.64 (Oct 26) and $70.02 (Oct 30), with a trough near $68.2 between them and a breakdown below it. Price is now at $66.98, so the pattern is confirmed if it closes below roughly $67. The measured move is peak ($70) minus neckline ($68.2) = about $1.8, projected from the neckline to about $66.4. That is only a first target. A fuller retracement of the rally toward the $65 confluence (SMA50/EMA55) and the $64.3 lower band is the more realistic target.
- Context: Within the larger uptrend this is more likely a corrective pullback than a full reversal, because the SMA50, EMA55 and SMA200 are all rising below price.
- Invalidation: A reclaim of $68.50 to $70 would negate the double top.
POTENTIAL SCENARIOS
- Scenario 1: Bearish Pullback to the $64–65 Support Zone — Double top confirmation, MACD and DI crossovers and fading CMF drive a retracement toward the SMA50/EMA55 confluence, possibly overshooting to the lower Bollinger Band. Trigger: daily close below $66.50 and failure to reclaim EMA21 ($67.20). Target: $64.50, with a stretch to $62.50–63.00 if $64.3 breaks. Invalidation: close above $68.50. (50% probability)
- Scenario 2: Bullish Uptrend Resumption — The dip is bought at EMA21/SMA50, the long-term uptrend reasserts, and price retests and breaks the $70 highs. Trigger: close above $68.50 with MACD re-crossing above signal and +DI retaking −DI. Target: $70.50–72.00. Invalidation: close below $64.80. (30% probability)
- Scenario 3: Neutral Range Consolidation — Weak ADX keeps price oscillating between the SMA50 and the double-top highs. Trigger: closes holding $65–$69 for several weeks. Target: about $66–67. Invalidation: close outside $64.30–$70.00. (20% probability)
PRICE TARGETS
For the 45-day horizon (to about Dec 18, 2026):
- Target Price: $64.50
- Expected Range: $59.50 to $70.00 (width $10.50, about 15.7% of the current price, which fits the 12–18% guidance for 30–60 days)
- Key Levels: Support at $65.08 (SMA50, with EMA55 at $64.86 just below), Resistance at $70.02 (double-top high). EMA21 at $67.20 is the minor first hurdle on the way up.
OVERALL BIAS
OVERALL BIAS: BEARISH - A double-top rejection near $70 with a bearish MACD crossover, a −DI/+DI flip, falling RSI and CMF, and a heavy-volume reversal candle point to a pullback toward the $64–65 SMA50/EMA55 support zone. The long-term uptrend limits the downside, and the weak ADX keeps conviction modest.
This is educational analysis and not financial advice.