QQQ 6-day bearish forecast — Nov 8, 2026
- Bias: Bearish
- Timeframe: 6 days (made Nov 8, 2026, target date Nov 13, 2026)
- Price at analysis: $656.22
- Price target: $647.50
- Expected range: $629.00 – $668.00
- Result: Incorrect (+2.8%) — closed at $674.59 on Nov 13, 2026; quality score 31/100
Get a free AI analysis of QQQ today
Analysis
TECHNICAL INDICATORS
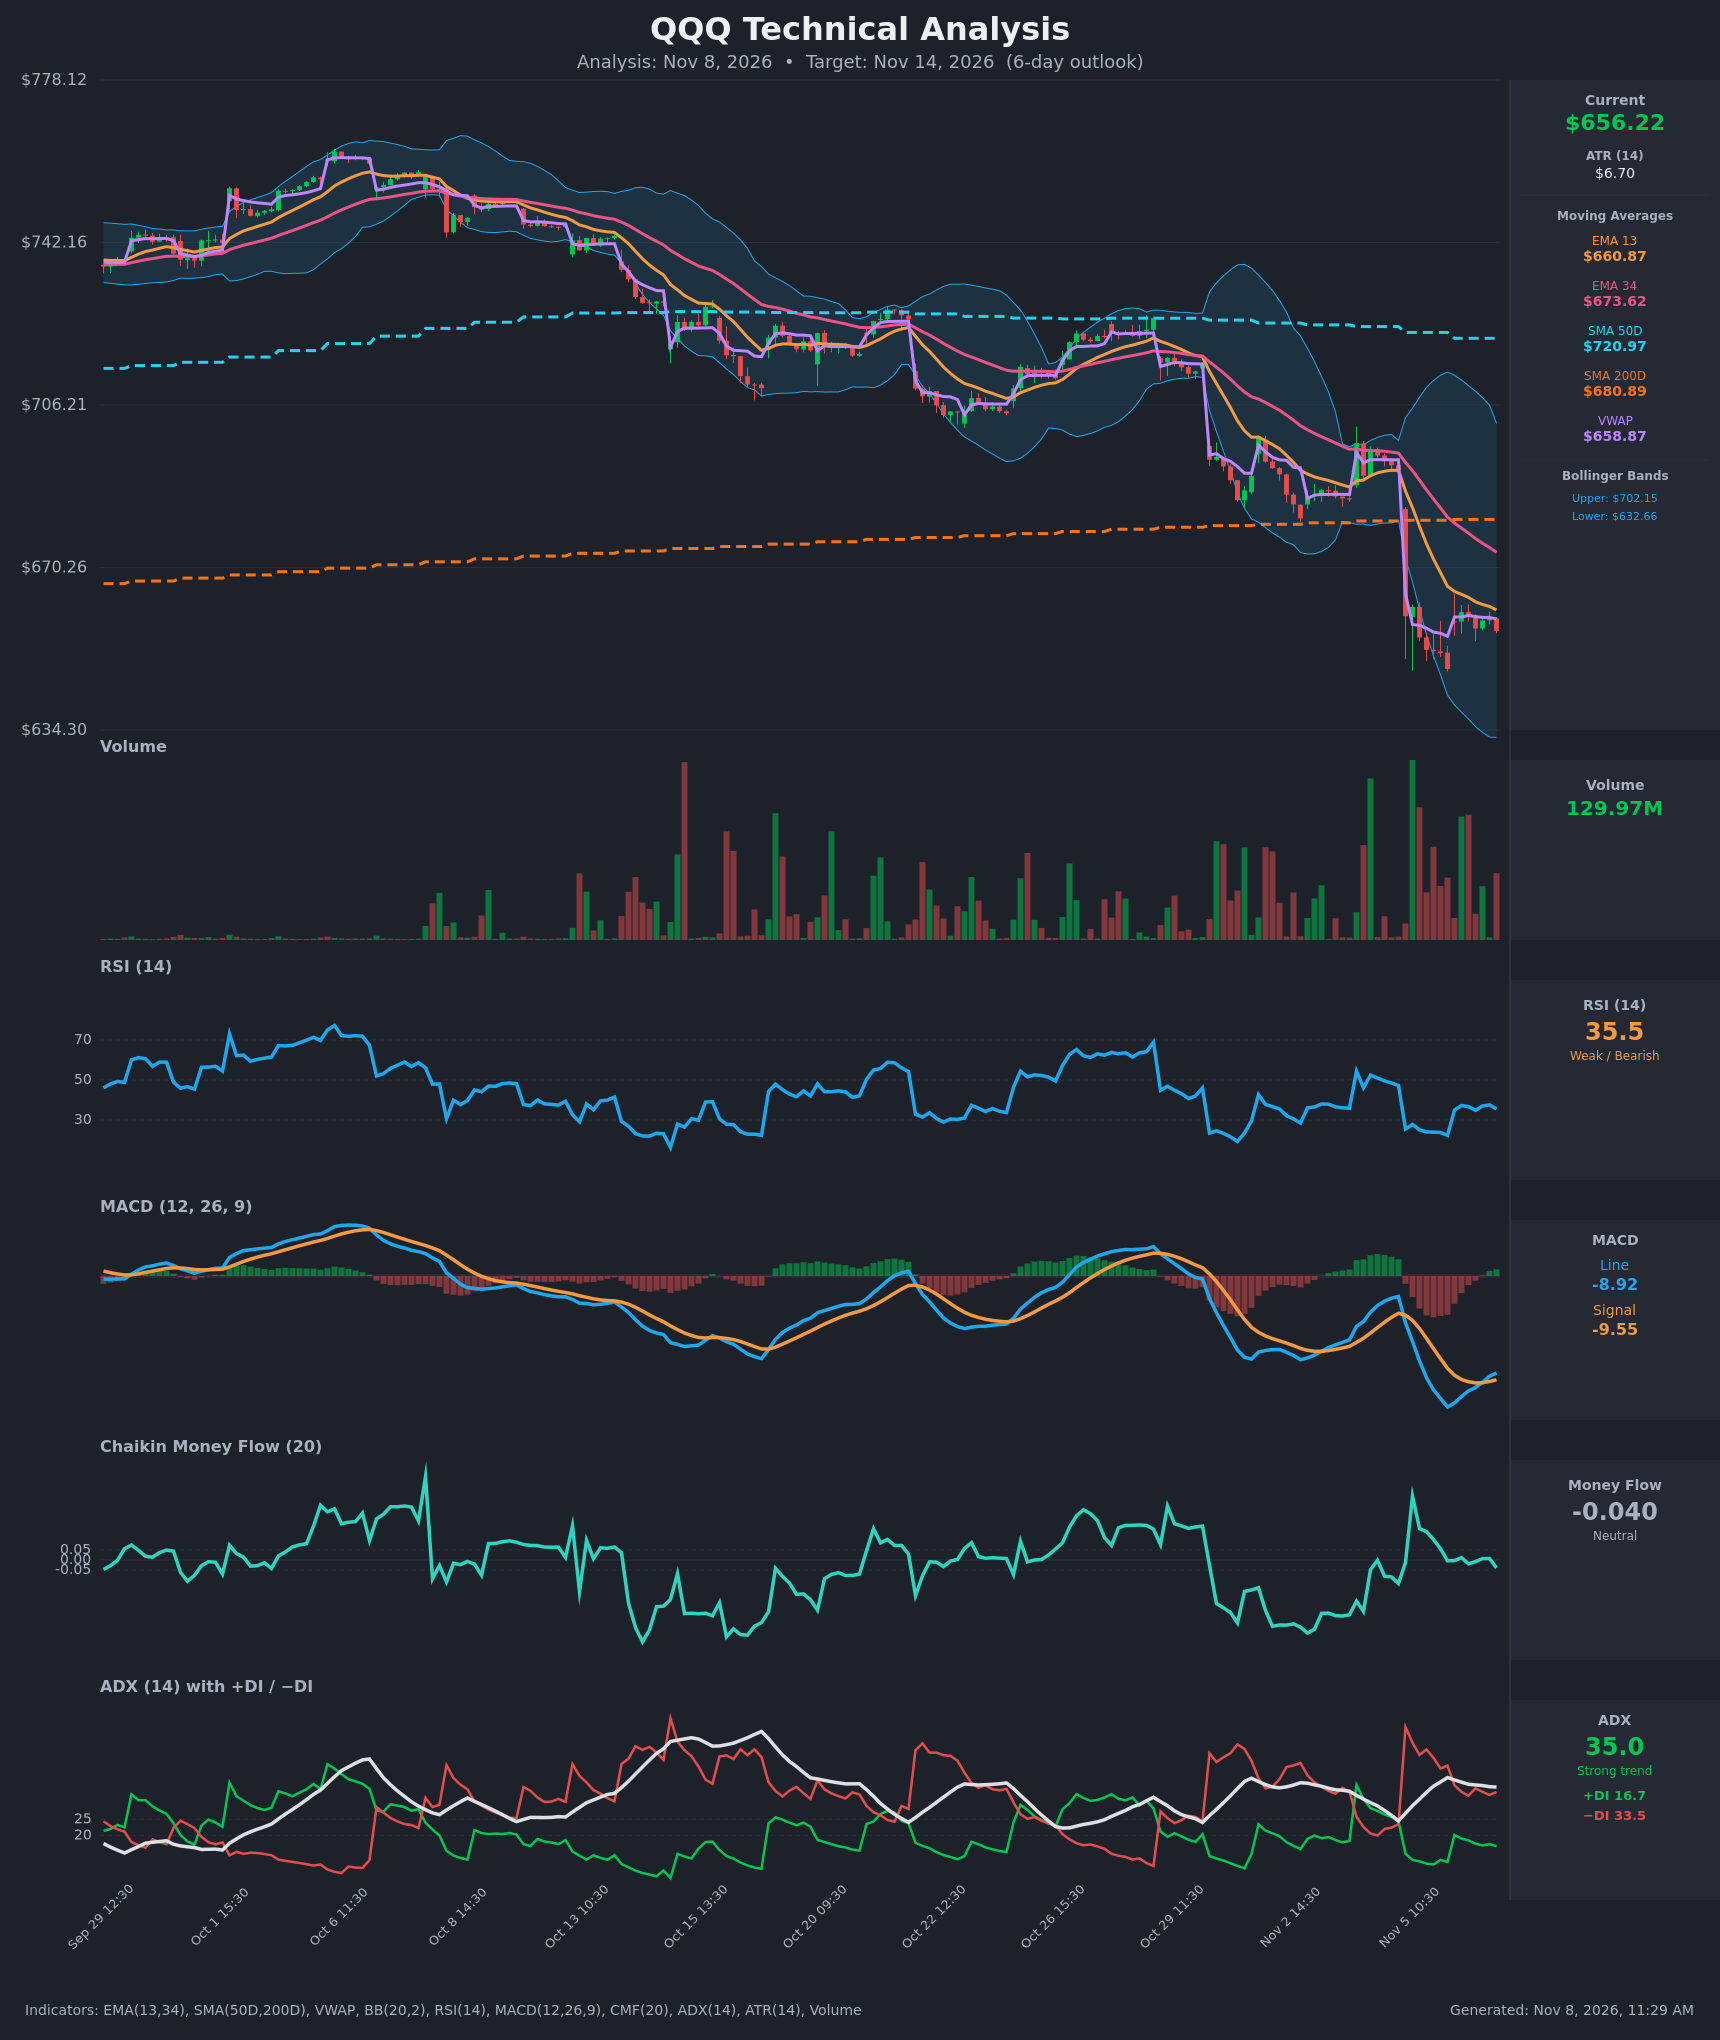
- RSI (14): 35.48. It bounced from an extreme 22.3 low on Nov 5 but has been stuck in the 35-37 area for the last 7 bars. That is a weak, bearish-leaning reading, not yet oversold, with no strong momentum recovery. [Bearish]
- 20 EMA: Only EMA 13 ($660.87) and EMA 34 ($673.62) are supplied, so I use them as proxies. Price at $656.22 is below both. EMA 13 is still falling and sits above price as near-term resistance, and EMA 13 is well below EMA 34 (a bearish cross that happened before Nov 4). [Bearish]
- MACD: Line -8.92 vs Signal -9.55, histogram about +0.62. The line crossed above the signal on Nov 6 13:30, a small bullish crossover. Both lines are deep below zero, so this is a relief bounce in a downtrend, not a trend reversal. [Neutral]
- Bollinger Bands (20): Upper $702.15, lower $632.66, midline about $667.40. Price is in the lower half, about $23.5 above the lower band. The bands are very wide after the Nov 5 gap-down, which means high volatility. Price below the midline confirms a downtrend, and a "band walk" lower is still possible. [Bearish]
- CMF (20): -0.040. The reading is between ±0.05, so it is neutral. Selling pressure has faded from the heavy distribution of late October and early November, but there is no accumulation. [Neutral]
- ADX (14): 35.0 with +DI 16.7 and −DI 33.5. This is a strong trend, but ADX has slipped from its 37.9 peak. −DI is roughly double +DI, so bears are firmly in control. [Strong Trend – Bearish]
- Volume: 129.97M, elevated compared with September and early October. The highest-volume bars came on the red gap-down, which marks the move as institutional distribution. Volume on the subsequent bounce attempts is lighter. [Bearish – selling volume dominated, weak bounce participation]
DIVERGENCES & TRENDS
- No clear price/RSI divergence. RSI made a lower low (22.3) with the price low, and the bounce has stalled around 35-37, which shows weak buying.
- MACD histogram has turned from deeply negative to slightly positive, a minor momentum improvement. It is happening below zero, which is typical of a bear-market relief rally.
- Moving averages:
- EMA 13 is below EMA 34.
- Price is below the SMA200D ($680.89), a break of the long-term trend line.
- The SMA50D ($720.97) is still above the SMA200D, so there is no death cross yet, but the gap is narrowing.
- DI lines: −DI has been above +DI since Nov 5, and +DI has not recovered above 20.
- VWAP: price at $656.22 is just under VWAP ($658.87), a mild sign of selling pressure.
- Lower highs and lower lows have been in place since late October.
CHART PATTERNS
- Bearish Flag / Pennant (continuation): After the sharp Nov 5 gap-down, price has consolidated in a tight $648-$661 range with slightly lower highs. This resembles a small bearish flag or pennant. A break below about $647.80 would project roughly the flagpole height (about $30) toward the lower Bollinger Band region ($632 and below).
- Larger structure: A series of lower highs and lower lows since the mid-October peak, a descending channel that points to trend continuation.
- Counter-case: A Bullish Falling Wedge or Double Bottom is not confirmed. The lows at $647.80 and about $651 are only a tentative base, and a reclaim of $661-$674 would be needed to invalidate the bearish structure.
POTENTIAL SCENARIOS
- Scenario 1: Bearish Flag Breakdown — The consolidation resolves lower as price is rejected at the falling EMA 13 / VWAP area (~$659-$661) and the −DI-dominated trend continues. Trigger: a close below $647.80 on rising volume. Target: $635-$640, near the lower Bollinger Band ($632.66). Invalidation: a close above $674 (EMA 34). (50% probability)
- Scenario 2: Bullish Relief Bounce — Oversold conditions and the MACD bullish cross fuel a mean-reversion rally toward the EMA 34 and the Bollinger midline. Trigger: a reclaim of $661 (EMA 13/VWAP) with improving CMF above +0.05. Target: $670-$676. Invalidation: a break below $647.80. (35% probability)
- Scenario 3: Neutral Chop — Price continues to coil between $648 and $661 as volatility contracts. Trigger: no decisive break of either boundary. Target: $650-$660. Invalidation: a close outside the $647.80-$661 range. (15% probability)
PRICE TARGETS
- Target Price: $647.50 (6-day horizon, Nov 14)
- Expected Range: $629.00 to $668.00 (width $39.00, about 5.9% of the current price, in line with the 4-8% guidance for a 6-day horizon)
- Key Levels: Support at $647.80, Resistance at $660.87
OVERALL BIAS
OVERALL BIAS: BEARISH - Price is below the EMAs, the SMA200D and VWAP, with a strong ADX (35) and −DI roughly double +DI. The consolidation after the gap-down looks like a bearish flag, while the small MACD bullish cross and neutral CMF argue only for a modest-conviction call and a possible relief bounce.
This is educational analysis and not financial advice.