QQQ 4-day bearish forecast — Nov 8, 2026
- Bias: Bearish
- Timeframe: 4 days (made Nov 8, 2026, target date Nov 11, 2026)
- Price at analysis: $656.22
- Price target: $648.50
- Expected range: $637.00 – $668.00
- Result: Incorrect (+5.2%) — closed at $690.38 on Nov 11, 2026; quality score 0/100
Get a free AI analysis of QQQ today
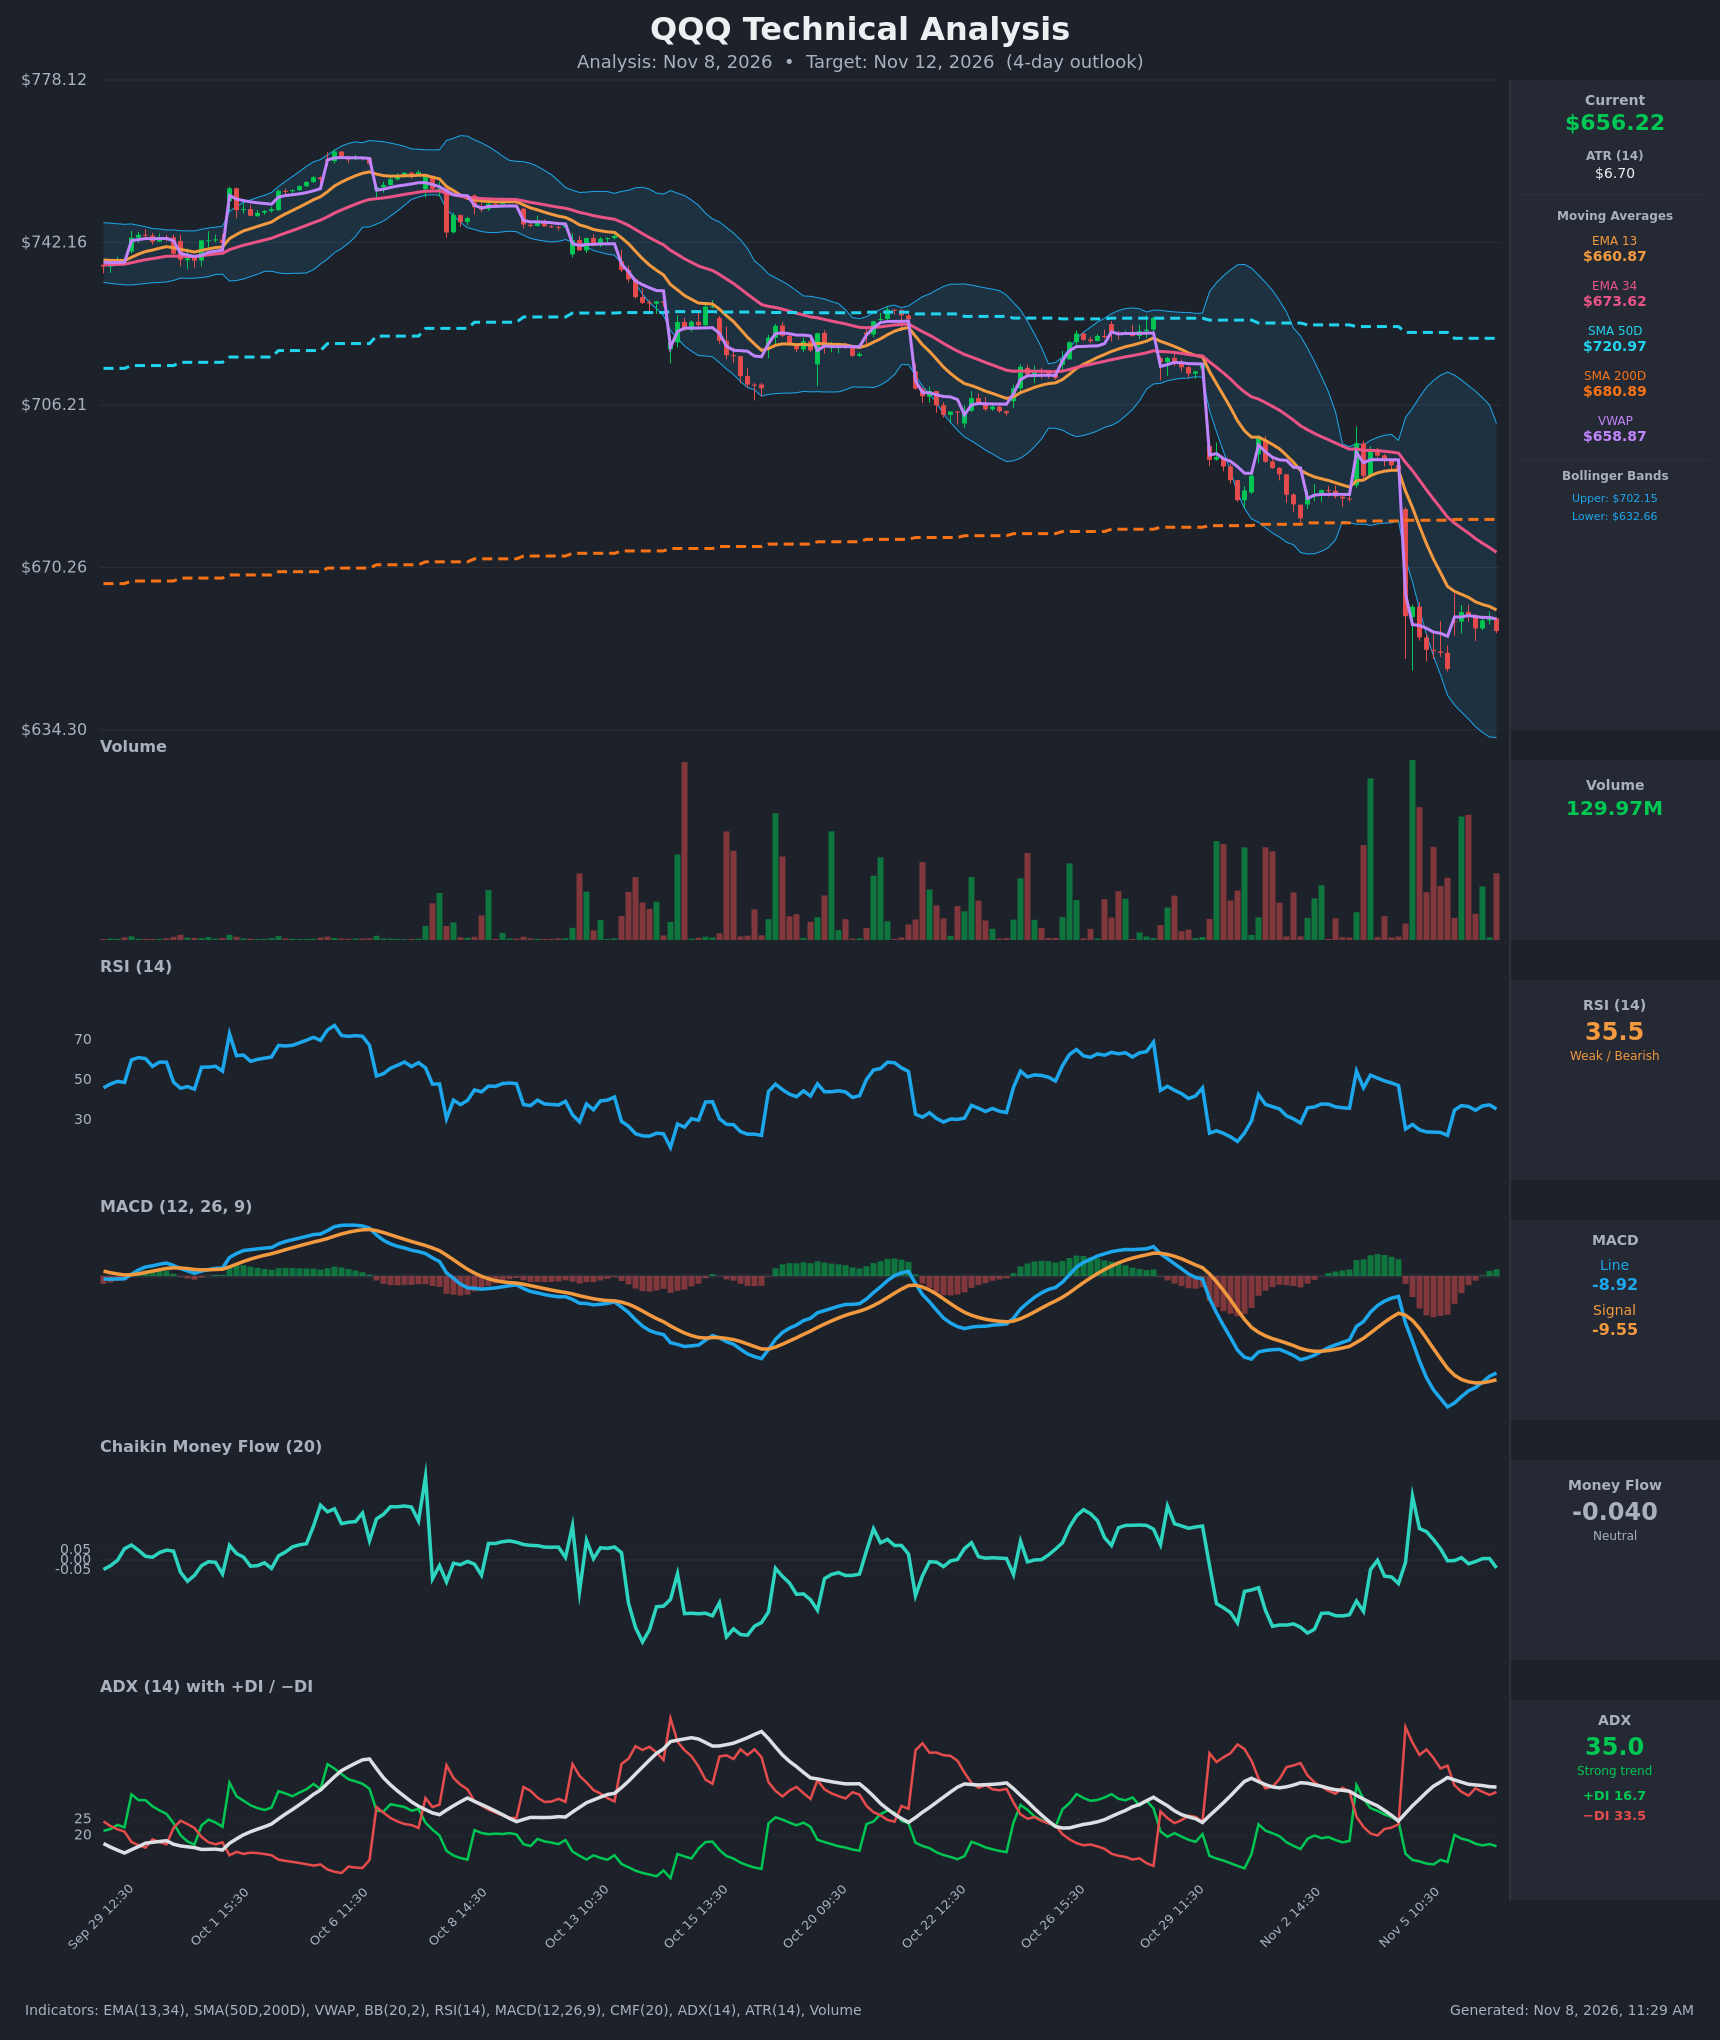
Analysis
TECHNICAL INDICATORS
- RSI (14): 35.48, recovering from a deeply oversold 22.3 on Nov 5 but stuck in the 35-37 zone and below 40. Momentum has stabilized, not turned. [Bearish]
- 20 EMA (EMA 13 / EMA 34 used): EMA 13 is $660.87 and EMA 34 is $673.62. Price ($656.22) is below both, and EMA 13 is below EMA 34, so the bearish cross is in force. EMA 13 capped the last several bounces. [Bearish]
- MACD: Line -8.92 and signal -9.55, so the histogram is just positive at about +0.6. The line has risen from -12.04 and is crossing above the signal. This is an early bullish crossover, but it is deep below zero and reads more like a relief bounce than a trend change. [Neutral]
- Bollinger Bands (20): Upper $702.15, lower $632.66, with a very wide band after the gap-down. Price is in the lower third, about $23.60 above the lower band. The bands are expanding, which signals a volatility-driven downtrend, and price is not yet at the band extreme. [Bearish]
- CMF (20): -0.040, hovering around zero after a brief positive stretch on Nov 5. There is no strong accumulation to support a rebound and no heavy distribution either. [Neutral]
- ADX (14): 35.0 with +DI 16.7 and −DI 33.5. This is a strong trend with the bears clearly on top, and ADX is only drifting lower from 37.9. [Strong Trend – Bearish]
- Volume: 129.97M, elevated. The heaviest volume came on the Nov 5 gap-down sell bars, and the rebound bars on Nov 6 had lighter, mixed volume. This suggests the bounce lacks conviction. [Bearish-leaning]
DIVERGENCES & TRENDS
- MACD vs. price: The MACD histogram has improved from -3.5 to +0.6 while price is flat at about $656. This is a mild bullish momentum improvement, but price has not made a higher low or broken above EMA 13.
- RSI: It has bounced from 22.3 to 35.5 but failed to get above 38 on any bounce. It is below the 40-60 band, which is typical of a bearish regime.
- Trend structure: The sequence of lower highs and lower lows since mid-October is intact. Price gapped from about $692 to about $659 on Nov 5 and has since consolidated in a narrow $648-$661 band.
- Moving averages: Price is now below SMA200 ($680.89) for the first time in this window and well below SMA50 ($720.97). The SMA50-SMA200 gap has narrowed to about $40, so a death cross is still possible if weakness continues. EMA 13 is below EMA 34, with a widening gap.
- VWAP: Price is at $656.22, below VWAP at $658.87. Each attempt to hold VWAP has failed.
- DI: −DI has been above +DI since Nov 5, although the spread narrowed from 53.6 vs 14.3 to 33.5 vs 16.7.
CHART PATTERNS
- Bearish Flag / Pennant (continuation): The Nov 5 gap-down acts as the flagpole. The tight consolidation at $648-$661 since then fits a bearish flag or pennant. A break below about $648 targets a measured move of roughly $30 lower, to about $620. This is the main pattern, though it is early and small.
- Possible Bullish Falling Wedge (reversal): This is a less likely alternative. The lower lows are not clearly converging, and the RSI and MACD improvement is the only supporting evidence. A close above EMA 13 and VWAP ($661-$662) would be needed to take it seriously.
- Larger structure: The decline from about $750 to $656 is a clear downtrend, consistent with a Bearish Descending channel rather than a base.
POTENTIAL SCENARIOS
- Scenario 1: Bearish Flag Breakdown — The consolidation resolves lower, in line with the strong ADX and −DI dominance. Sellers defend EMA 13 and VWAP, and price retests the Nov 5 lows. Trigger: a close below $647.80, the Nov 5 closing low. Target: $640 first, then the lower Bollinger Band near $632.66. Invalidation: a close above $661, then $673.60 (EMA 34). (50% probability)
- Scenario 2: Bullish Oversold Relief Bounce — The MACD bullish cross and RSI recovery from oversold fuel a mean-reversion bounce toward the overhead moving averages. Trigger: a break and hold above $661 (EMA 13 and VWAP) on rising volume. Target: $673 (EMA 34), possibly up to $680 (SMA200). Invalidation: a close back below $650. (35% probability)
- Scenario 3: Neutral Range Chop — Price stays in the $648-$662 base through the window, with low-conviction trading as the market digests the gap. Trigger: failed breaks on both sides. Target: about $655. Invalidation: a decisive close outside $646-$664. (15% probability)
PRICE TARGETS
Timeframe: 4 days (target date Nov 12, 2026).
- Target Price: $648.50
- Expected Range: $637.00 to $668.00 (width $31.00, about 4.7% of current price, which fits the 4-day timeframe)
- Key Levels: Support at $640.00, Resistance at $660.87
OVERALL BIAS
OVERALL BIAS: BEARISH - The trend is strong (ADX 35, −DI 33.5 vs +DI 16.7). Price is below EMA 13, EMA 34, VWAP and SMA200, and the post-gap consolidation looks like a bearish flag. The MACD bounce and the oversold RSI temper conviction and leave a real chance of a relief rally, but the evidence still favors a modest further decline.
This is educational analysis and not financial advice.