TSLA 6-day bearish forecast — Nov 8, 2026
- Bias: Bearish
- Timeframe: 6 days (made Nov 8, 2026, target date Nov 13, 2026)
- Price at analysis: $358.20
- Price target: $350.00
- Expected range: $339.50 – $363.00
- Result: Incorrect (+8.1%) — closed at $387.16 on Nov 13, 2026; quality score 0/100
Get a free AI analysis of TSLA today
Analysis
TECHNICAL INDICATORS
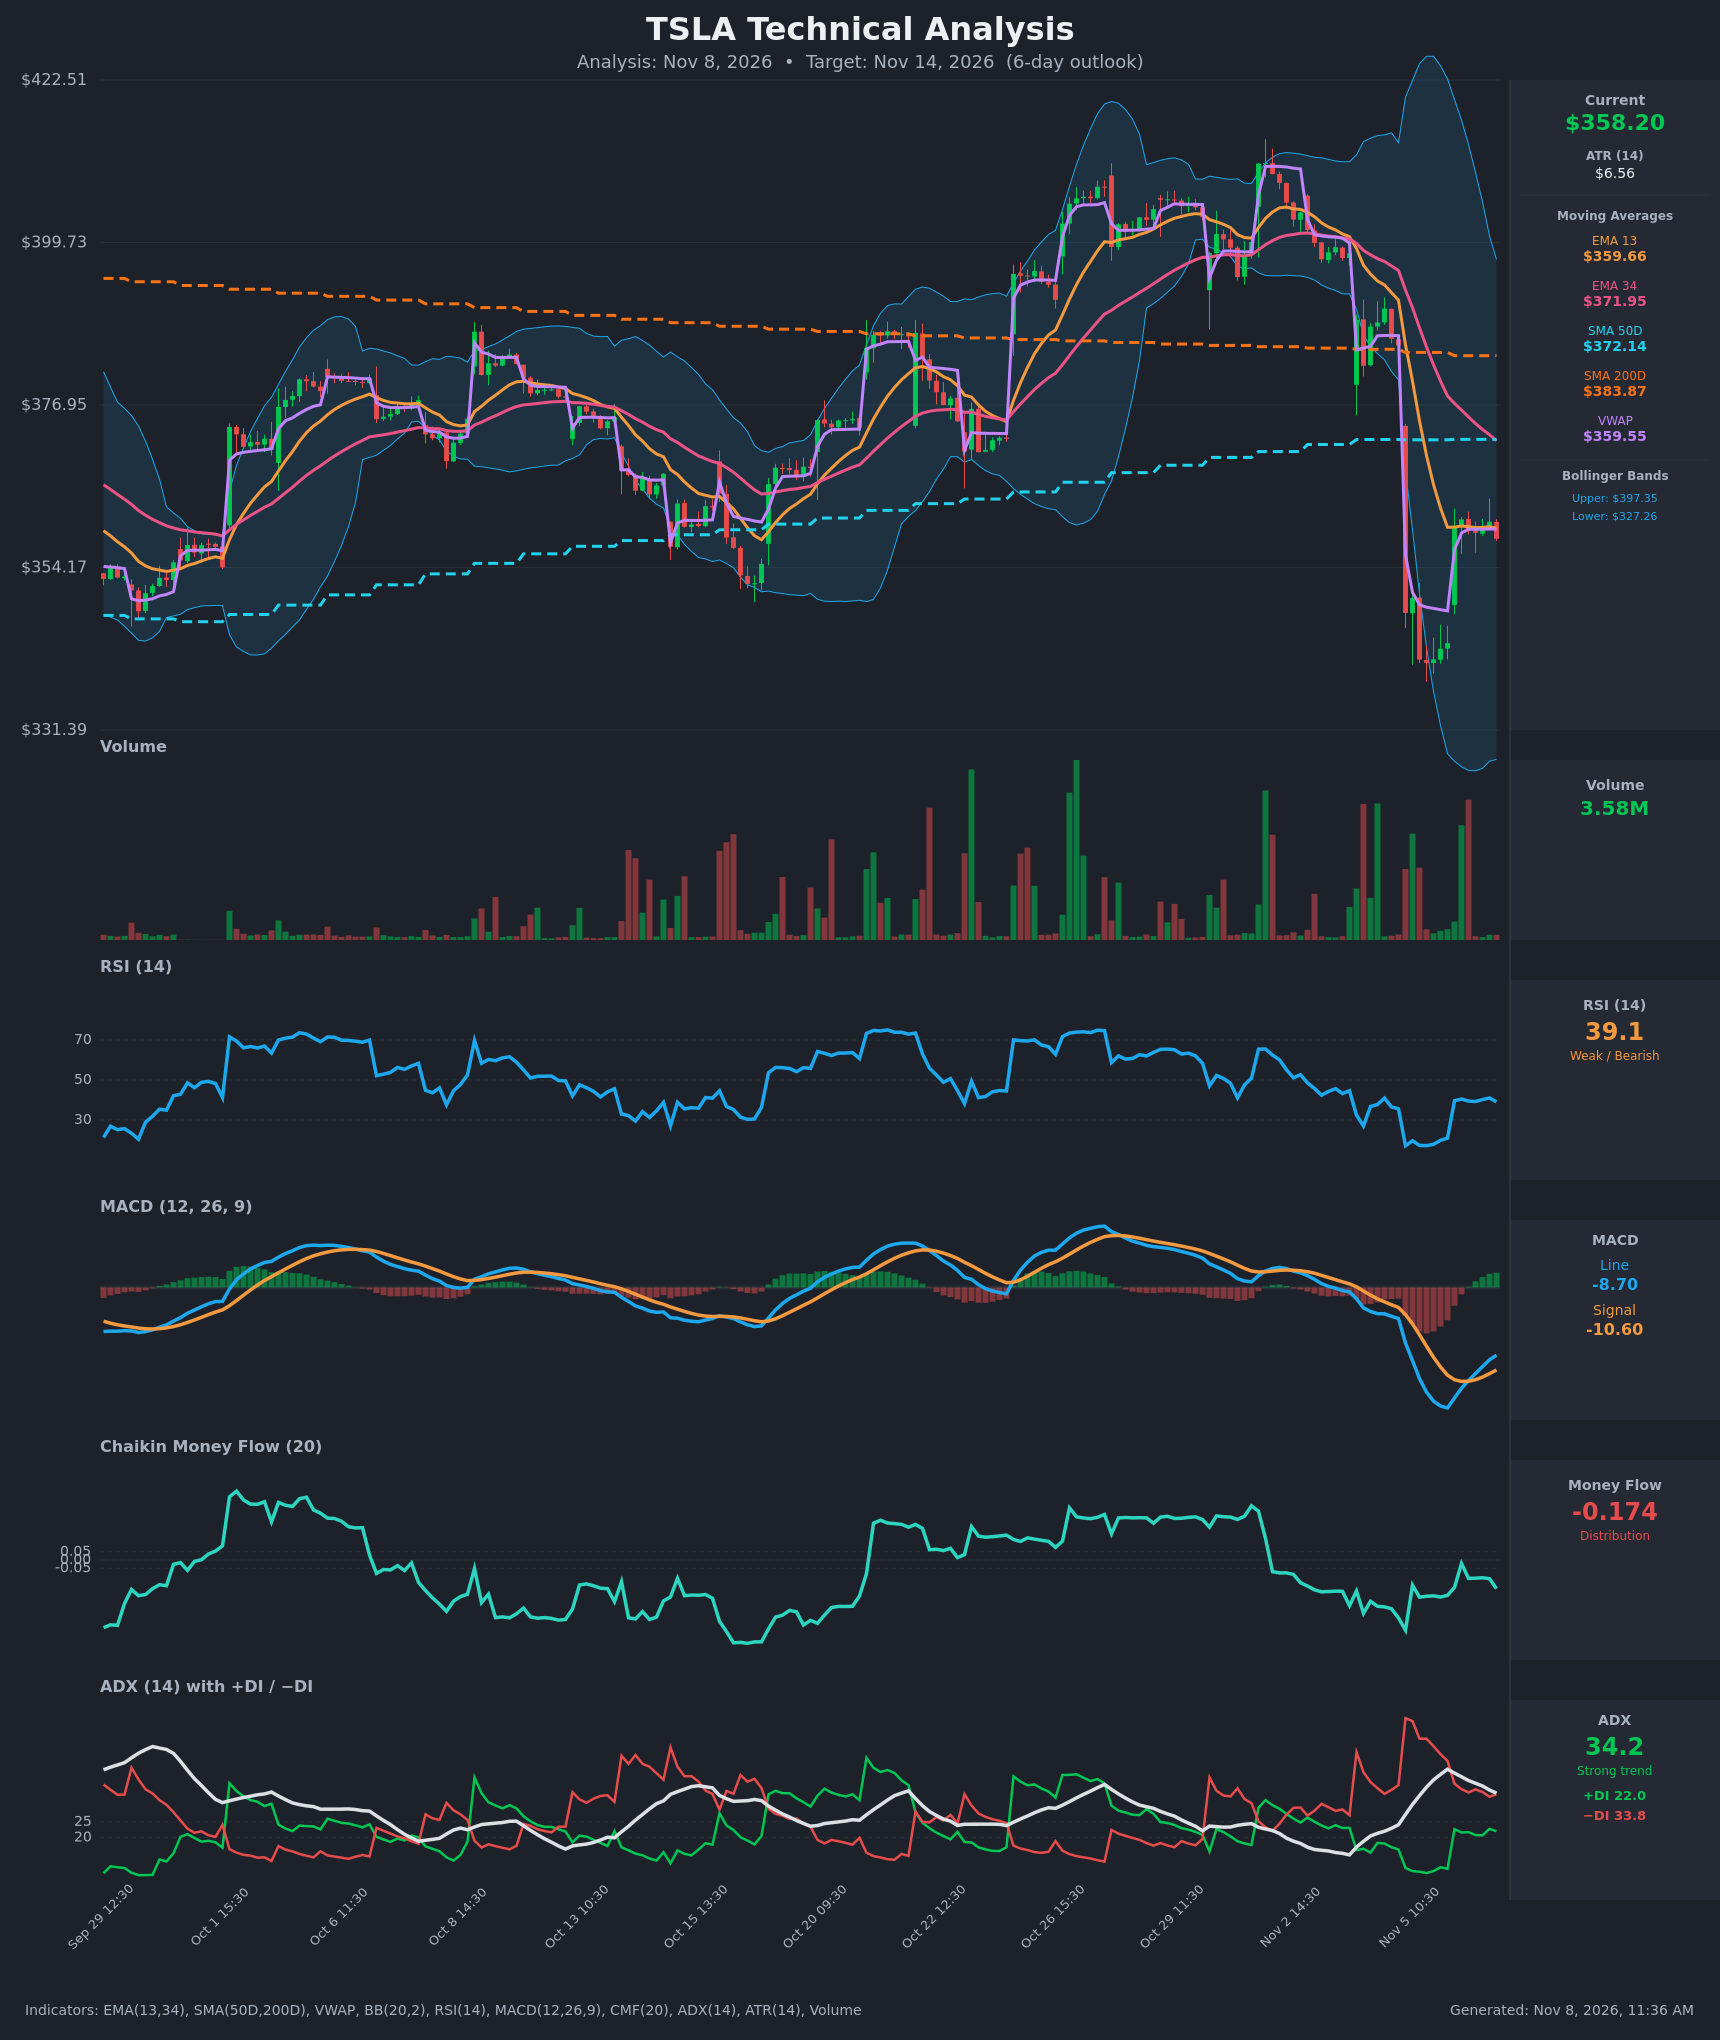
- RSI (14): 39.08, up from the 17 oversold extreme on Nov 5 but stalled around 39-41 for the last seven bars. It is below 50 and has not regained the mid-line, so momentum is weak with no fresh upside thrust. [Bearish]
- 20 EMA: Using the supplied EMA 13 ($359.66) and EMA 34 ($371.95): price ($358.21) sits just under the EMA13, which is flat and acting as immediate resistance. EMA13 is below EMA34 by about $12, and the gap is narrowing only because price is flat. [Bearish]
- MACD: Line -8.70 versus signal -10.60. The line is above the signal, so a bullish cross has already occurred, but both are deeply negative and below zero. The histogram is turning positive from its low and the line is rising. This is an early relief-bounce signal inside a bearish structure. [Neutral]
- Bollinger Bands (20): Upper $397.35, lower $327.26, middle about $362.30. Price sits just below the midline. The bands are very wide from the gap-down, so volatility is elevated but contracting. A close below the midline favours the lower half of the bands. [Bearish]
- CMF (20): -0.174, well below -0.05. It has been negative since the Nov 5 gap, with only brief attempts to recover (-0.02 on Nov 6). This is sustained distribution. [Distribution]
- ADX (14): 34.2, a strong trend but falling from 41.9. −DI (33.8) is above +DI (22.0), so bears control. The falling ADX with −DI still on top suggests the selloff is maturing and may now consolidate or grind. [Strong Trend – Bearish]
- Volume: 3.58M on the latest bar, far below the heavy gap-day volume. The bounce from $340 to $360 and the sideways drift since came on fading volume, which suggests a weak recovery rather than real buying. [Neutral-to-Bearish]
DIVERGENCES & TRENDS
- Price made lower lows on Nov 5 while RSI hit 17, a washout. RSI has since recovered to about 40 and is capped there. There is no clean bullish divergence, only an oversold bounce.
- MACD bullish line/signal cross, with the histogram rising from -4 to -2, versus price flat at $359-$361. Momentum is improving faster than price, but still below zero.
- Since Nov 6 open, price has compressed into a very tight $358-$361 band right at the EMA13 and VWAP ($359.55). This points to a coil and a likely directional break.
- Price is below EMA34 ($371.95), SMA50 ($372.14) and SMA200 ($383.87). SMA50 is below SMA200, so the long-term structure is bearish and no golden cross is near. EMA13 crossed below EMA34 on Nov 5.
- −DI dominance and negative CMF are intact. ADX is rolling over from 41.9, which signals trend fatigue rather than reversal.
CHART PATTERNS
- Bearish Pennant / Bearish Flag (continuation): The sharp gap-down from $385 to $341 forms the pole. The tight sideways consolidation at $358-$361 is the pennant or flag. A break below roughly $357-$358 projects toward the Nov 5 low zone ($340.80). A full measured move of about $37 is too large for 6 days, so $345-$350 is more realistic.
- Unfilled gap overhead: The gap from $385 to $348 acts as resistance. The $372 confluence (EMA34 and SMA50) is the first key barrier on a relief rally.
- Possible Bullish Double Bottom: The $340-$341 retests on Nov 5 are a weak candidate. It would need a break above the $361 neckline and a reclaim of $372 to confirm. This is a lower-probability alternative.
POTENTIAL SCENARIOS
- Scenario 1: Bearish Pennant Breakdown — Price loses the EMA13/VWAP cluster and the consolidation low, with −DI and distribution continuing. Trigger: hourly close below $356.50 on rising volume. Target: $345-$350, with an extension to the $340.80 Nov 5 low. Invalidation: close above $366. (50% probability)
- Scenario 2: Bullish Relief Rally — The MACD cross and oversold RSI bounce carry price up to fill part of the gap. Trigger: close above $362.30 (BB midline) and $365. Target: $371-$373 (EMA34/SMA50 confluence). Invalidation: failure at $372 or a drop back under $356. (32% probability)
- Scenario 3: Neutral Range Chop — Price keeps coiling between $352 and $365 as ADX fades. Trigger: no close outside $356-$365. Target: $358-$360. Invalidation: a decisive close outside the range. (18% probability)
PRICE TARGETS
- Target Price: $350.00 (6-day horizon, about -2.3%)
- Expected Range: $339.50 to $363.00 (width $23.50, about 6.6% of current price, consistent with a 6-day window and about 3.5x ATR)
- Key Levels: Support at $340.80, Resistance at $372.00
OVERALL BIAS
OVERALL BIAS: BEARISH - Price is below all key moving averages with −DI above +DI, ADX at 34, CMF at -0.17 and fading volume on the bounce. The tight consolidation after the gap-down resembles a bearish pennant, so a downside resolution toward $350 is the most probable outcome. The MACD cross and oversold RSI argue for a relief bounce toward $372 as the main risk.
This is educational analysis and not financial advice.