TSLA 4-day bearish forecast — Nov 8, 2026
- Bias: Bearish
- Timeframe: 4 days (made Nov 8, 2026, target date Nov 11, 2026)
- Price at analysis: $358.20
- Price target: $353.50
- Expected range: $345.50 – $366.00
- Result: Incorrect (+8.2%) — closed at $387.40 on Nov 11, 2026; quality score 0/100
Get a free AI analysis of TSLA today
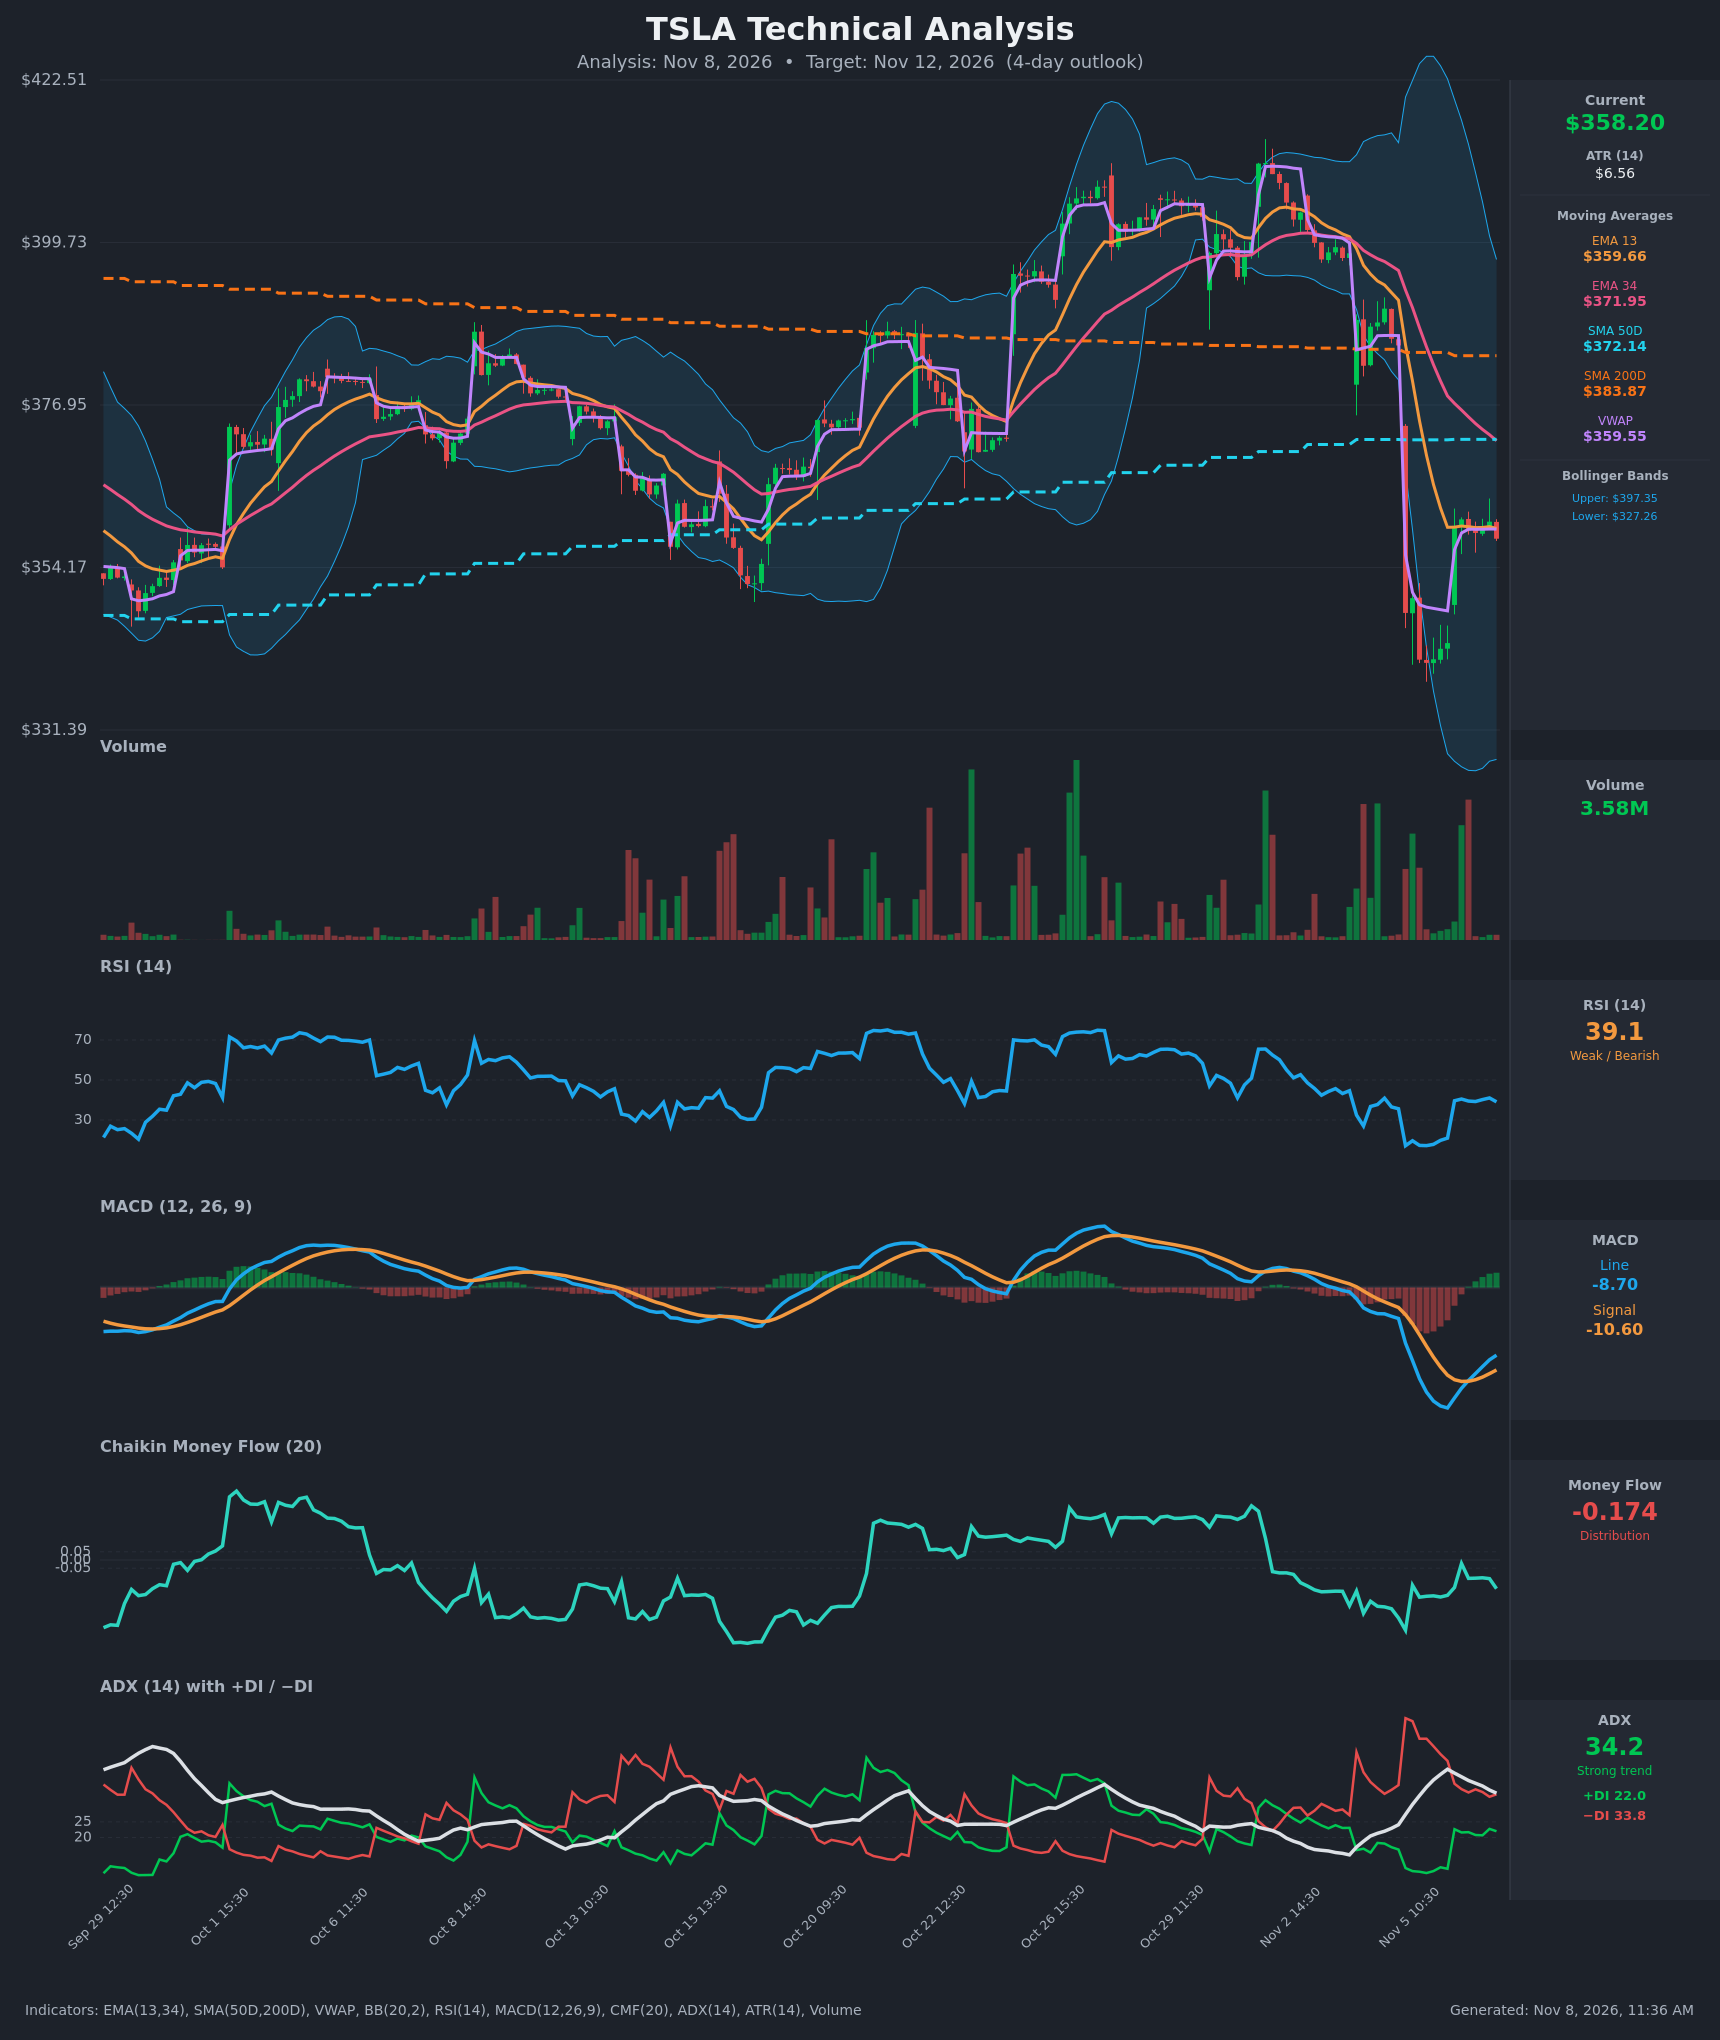
Analysis
TECHNICAL INDICATORS
- RSI (14): 39.1. It bounced from a deeply oversold 17 on Nov 5 to about 40 and has stalled there for the last 7 bars. The recovery is capped well below 50, so momentum is still weak. [Bearish]
- 20 EMA: The chart shows EMA 13 at $359.66 and EMA 34 at $371.95. Price ($358.21) is just under EMA 13 and about 3.7% below EMA 34, which has been rolling over. EMA 13 sits below EMA 34, so the short-term trend is down. [Bearish]
- MACD: Line -8.70, signal -10.60, so the line is above the signal. It crossed up on Nov 6 at 11:30 and the histogram is positive and rising. Both lines are deeply negative, so this is a relief bounce inside a bearish regime, not a trend reversal. [Neutral]
- Bollinger Bands (20): Upper $397.35, lower $327.26, midline about $362. The bands are very wide after the Nov 5 gap-down volatility spike. Price is just below the midline and well off the lower band, so it has moved from a band-walk into a mean-reversion pause. [Neutral]
- CMF (20): -0.174, well below -0.05, and it has stayed negative since the Nov 3-4 selloff. Even during the bounce it never turned positive, so sellers are still distributing into strength. [Distribution]
- ADX (14): 34.2 with -DI 33.8 above +DI 22.0. ADX is above 25 but fading from its 41.9 peak. The trend is strong and bearish, but the selling is losing steam. [Strong Trend – Bearish]
- Volume: 3.58M on the latest bar, which is light. The bounce from $341 to $360 came on modest volume, while the Nov 5 breakdown came on heavy volume. A weak-volume bounce after a high-volume drop favors sellers. [Bearish-leaning]
Other levels:
- VWAP: $359.55, so price is slightly below it, which is mild selling pressure.
- SMA 50D: $372.14, resistance overhead.
- SMA 200D: $383.87, resistance overhead. SMA 50D is below SMA 200D, a bearish long-term structure.
DIVERGENCES & TRENDS
- Price is below EMA 13, EMA 34, SMA 50D, SMA 200D and VWAP, and the Nov 5 gap-down broke below the earlier range.
- MACD has crossed up while RSI and CMF have not confirmed. RSI is stuck at about 40 and CMF is still sharply negative, so the MACD cross looks like a lagging artifact of the bounce.
- Since Nov 6 the bars have been tightly compressed between about $358 and $361. The range is narrow and the +DI/-DI gap (22 vs 34) has stopped widening.
- ADX is falling from 41.9 to 34.2, so the downtrend is maturing. This favors either a consolidation or a controlled drift lower rather than another waterfall leg.
- EMA 13 is flattening at $359.7 and acts as immediate resistance. EMA 34 is falling toward price (about $372).
CHART PATTERNS
- The best fit is a Bearish Flag / Pennant (continuation). A sharp impulse down from about $385 to about $341 was followed by a tight, low-volume consolidation around $358-$361. A breakdown below about $357 would target a measured move roughly equal to the pole, but I only expect a partial move in 4 days (about $345-$350).
- There is also a gap-fill dynamic. The bounce has recovered about half the gap from $385, and the next major overhead barrier is the $372 confluence (SMA 50D / EMA 34).
- Bullish alternative: if price holds $355 and reclaims $361-$362 (EMA 13, VWAP and the Bollinger midline), a short-term bounce toward $372 is possible. That would be a retest of broken support, not a trend change.
POTENTIAL SCENARIOS
- Scenario 1: Bearish Flag Breakdown — Price fails to reclaim EMA 13/VWAP and the flag resolves down in line with the dominant -DI and negative CMF. Trigger: hourly close below $356 on rising volume. Target: $347.80 first, then $341. Invalidation: hourly close above $362 (EMA 13/VWAP/BB midline reclaimed). (50% probability)
- Scenario 2: Bullish Relief Rally to Moving-Average Resistance — The MACD upturn and the oversold bounce extend, and short covering lifts price into the $370 area. Trigger: close above $362 with volume expansion. Target: $370-$372 (EMA 34 / SMA 50D). Invalidation: loss of $355. (30% probability)
- Scenario 3: Neutral Range Chop — Price keeps compressing between about $352 and $362 as ADX fades. Trigger: no decisive close outside that band. Target: $355-$360. Invalidation: a break of either side on volume. (20% probability)
PRICE TARGETS
For the 4-day timeframe (about 4% of price; the range width is $20.50 / $358.21 ≈ 5.7%, scaled for the high-volatility regime and ATR of $6.56 per hour):
- Target Price: $353.50
- Expected Range: $345.50 to $366.00
- Key Levels: Support at $347.80, Resistance at $361.00 (a close above it would put $372 in play)
OVERALL BIAS
OVERALL BIAS: BEARISH - Price is below every major moving average and VWAP, -DI leads +DI with ADX at 34, CMF is deeply negative, and the weak-volume consolidation after a sharp drop looks like a bearish flag. The MACD cross is a lagging relief signal and RSI is capped near 40, so a drift lower toward about $353 is the more probable outcome, with a rally above $362 as the invalidation.
This is educational analysis and not financial advice.