TQQQ 4-day bearish forecast — Nov 8, 2026
- Bias: Bearish
- Timeframe: 4 days (made Nov 8, 2026, target date Nov 11, 2026)
- Price at analysis: $52.25
- Price target: $50.60
- Expected range: $48.30 – $53.60
- Result: Incorrect (+12.6%) — closed at $58.82 on Nov 11, 2026; quality score 0/100
Get a free AI analysis of TQQQ today
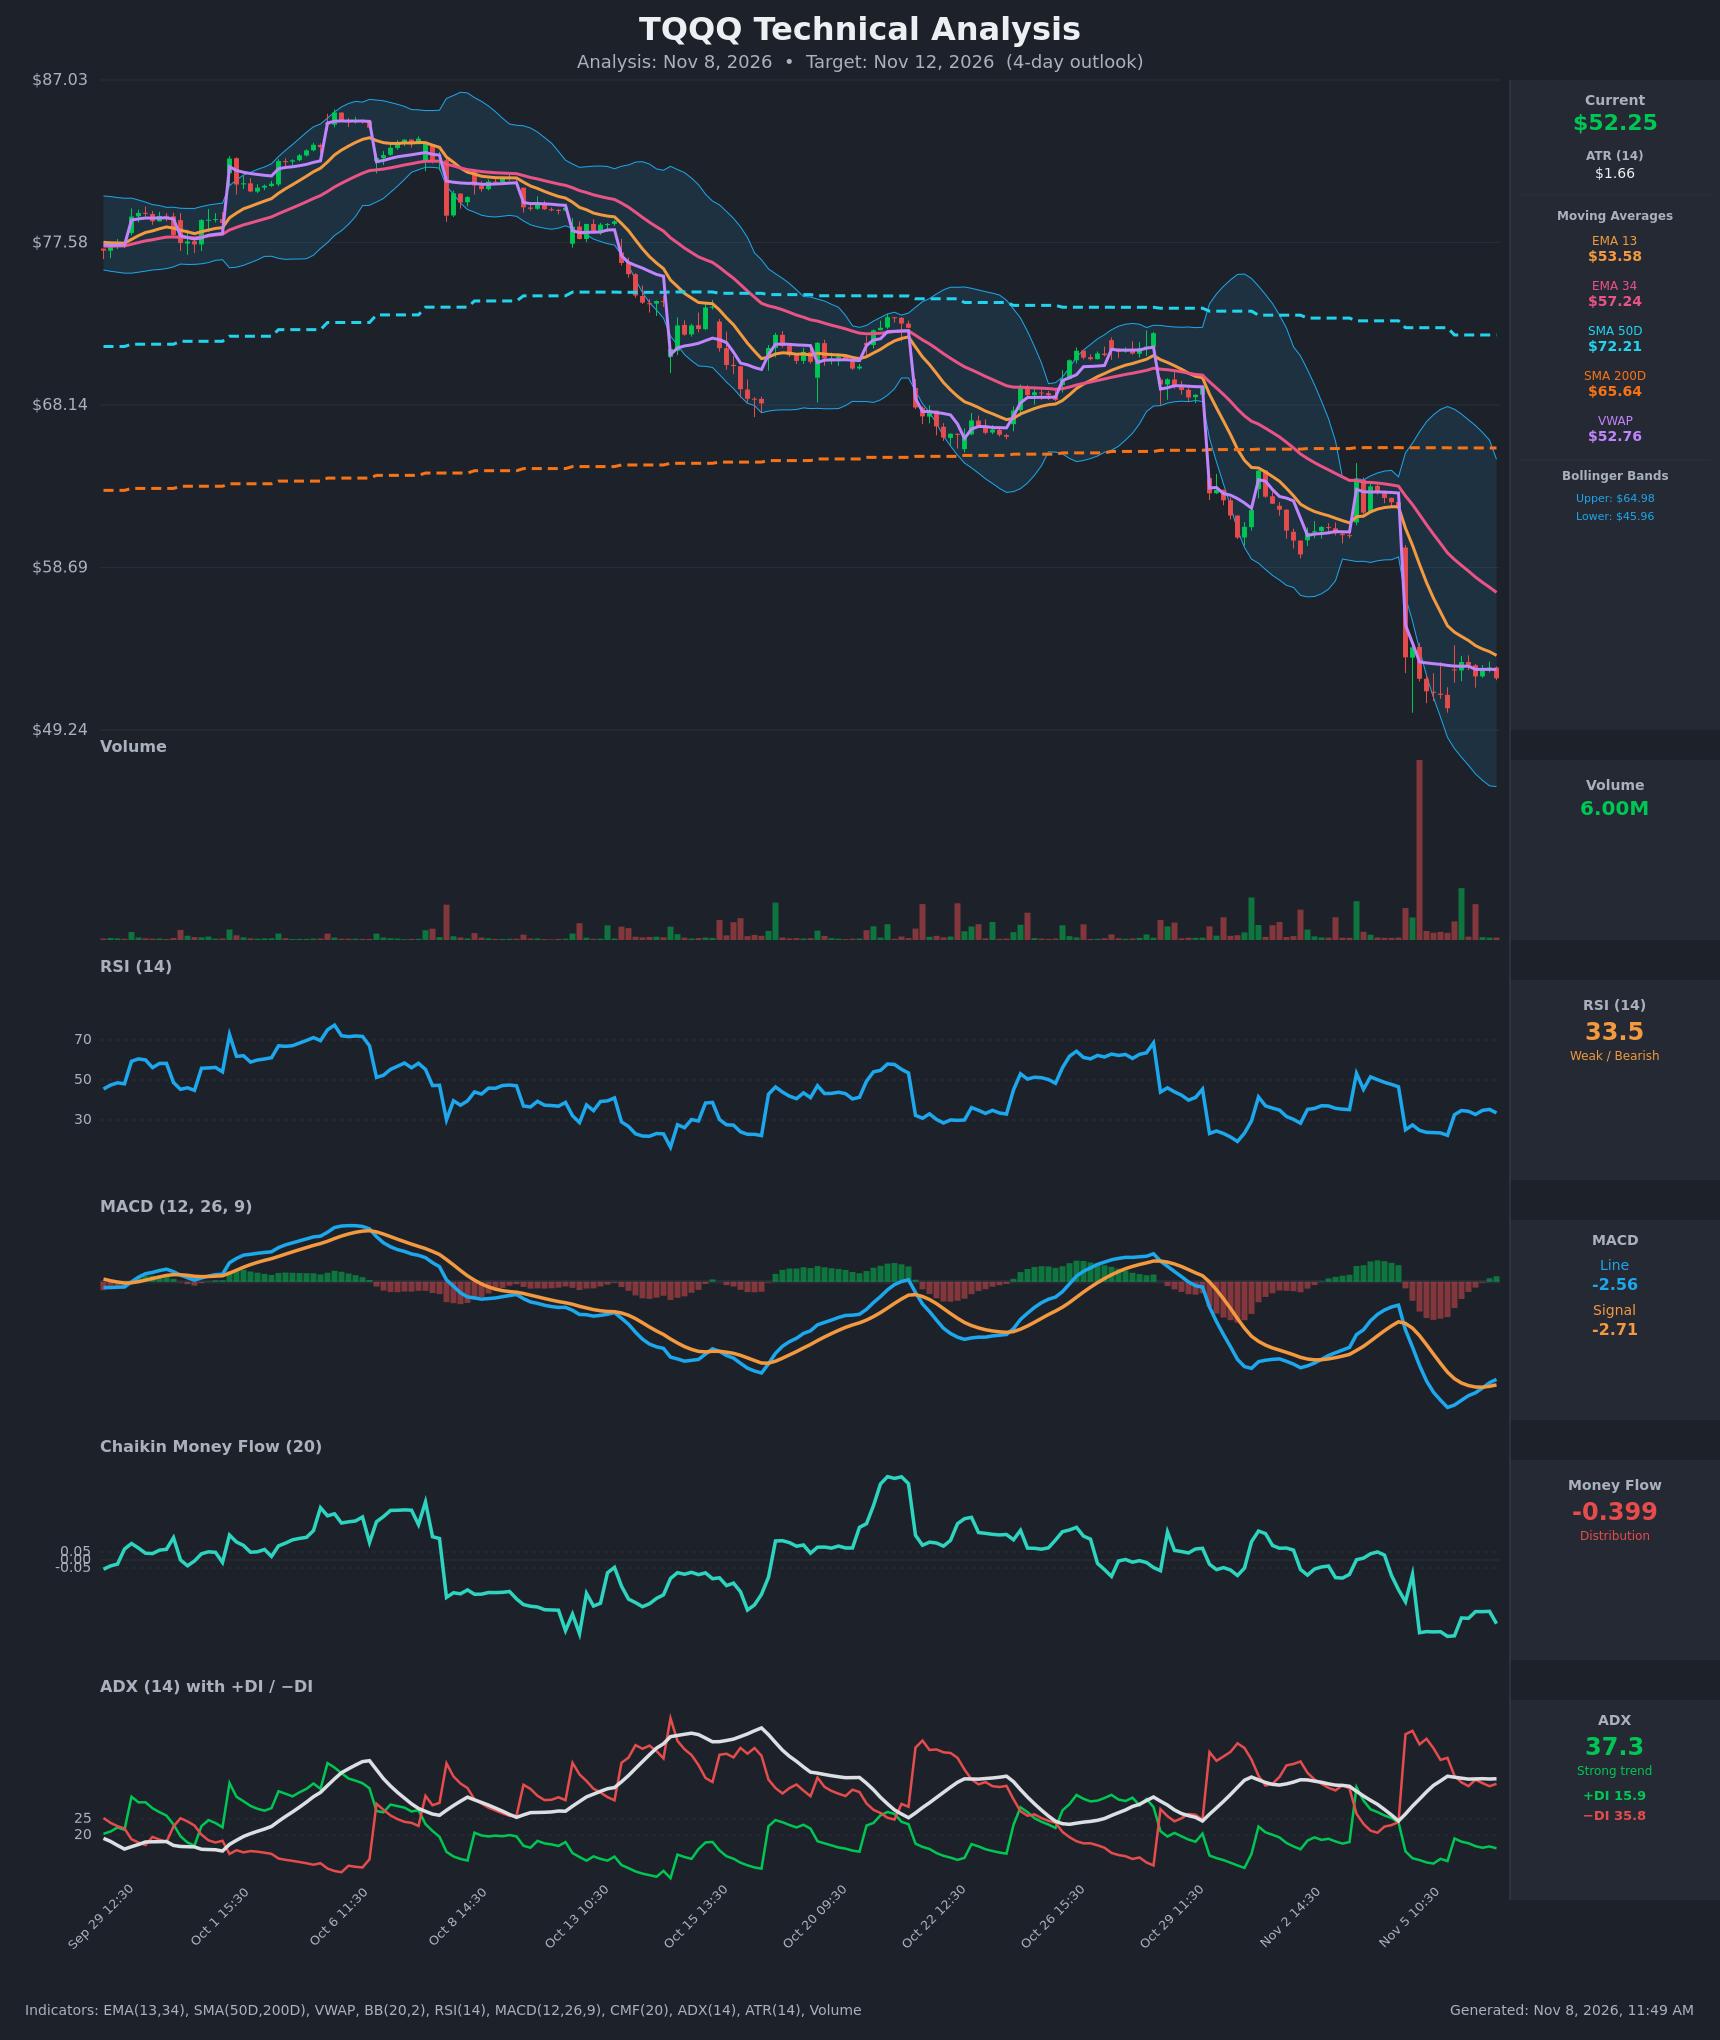
Analysis
TECHNICAL INDICATORS
- RSI (14): 33.54, just above oversold. It bounced from 22.3 (Nov 5 15:30) to the low-to-mid 30s and has stalled there. Momentum is weak but not accelerating lower. [Bearish]
- 20 EMA: The data gives EMA13 at $53.58 and EMA34 at $57.24. Price at $52.25 is below both, and both are sloping down, so they act as overhead resistance. EMA13 has been above price since the Nov 5 gap-down. [Bearish]
- MACD: Line -2.564 is above signal -2.710, a small bullish crossover on Nov 6 13:30. The histogram is slightly positive (+0.15) and rising, but both lines sit deep below zero. This looks like a relief bounce rather than a trend change. [Neutral]
- Bollinger Bands (20): Upper $64.98, lower $45.96, mid ~$55.5. Price is in the lower half, below the midline, and the bands are very wide after the Nov 5 crash. The wide bands imply high volatility. Price is not hugging the lower band, so the selling impulse has cooled. [Bearish]
- CMF (20): -0.399, well below -0.05. Distribution is heavy and sustained, with no sign of accumulation. [Distribution]
- ADX (14): 37.3, a strong trend, and flat to slightly lower from the 38.1 peak. -DI (35.8) is far above +DI (15.9), so bears control. The trend is strong but may be maturing. [Strong Trend – Bearish]
- Volume: 6.00M on the latest bar. Volume spiked massively on the Nov 5 breakdown (the biggest bar on the chart) and has faded since. The post-crash consolidation is on lower volume, which is typical of a bear-flag or pause. [Bearish continuation bias, fading selling pressure]
DIVERGENCES & TRENDS
- RSI made a higher low (~22.3 → 32–35 range) and MACD is crossing up while price sits near its lows. This is a mild momentum improvement, not a confirmed bullish divergence, because price has not made a clean new low alongside it.
- MA structure is bearish. Price is below EMA13, EMA34, SMA200D ($65.64) and SMA50D ($72.21). SMA50D is still above SMA200D, so there is no death cross yet, but the gap is closing.
- EMA13 is below EMA34 (bearish crossover since early Nov), and the gap is widening.
- Price is trading right at VWAP ($52.76), slightly below it. That is a neutral-to-bearish sign.
- The Nov 5 gap down (~$62 → $53) left a large unfilled gap overhead.
- Trend behavior: the market has been making lower highs and lower lows since the ~$85 peak in early October.
CHART PATTERNS
- Bearish Flag / Pennant (continuation): After the sharp impulse down on Nov 5, price has consolidated in a tight $50.5–$54 range on declining volume. This matches the Bearish Flag/Pennant from the reference diagram. A break below ~$50.5 projects a measured move of roughly the pole (~$9), toward $42–$44, though that is beyond a 4-day horizon.
- The broader structure is a series of lower highs, similar to a descending channel.
- Counter-case: the base near $50.5 is a possible small double-bottom, but it is not confirmed unless price closes above ~$54.
POTENTIAL SCENARIOS
- Scenario 1: Bearish Flag Breakdown — Price fails at the EMA13 / VWAP area and rolls over, breaking the Nov 5 low. Trigger: close below $50.50 with rising volume. Target: $48.00 to $49.00 (ATR-scaled, ~2 ATR). Invalidation: close above $54.50. (50% probability)
- Scenario 2: Neutral Range Consolidation — Price keeps chopping between $50.5 and $54 as the MACD bounce fades and RSI hovers in the low 30s. Trigger: failure to clear EMA13 and failure to break $50.5. Target: $51.50 to $53.00. Invalidation: close outside $50.00–$55.00. (25% probability)
- Scenario 3: Bullish Relief Bounce — A short-covering rally on the MACD cross and RSI uptick fills part of the gap. Trigger: close above $54.00 (EMA13 / flag top). Target: $56.50 to $57.20 (EMA34). Invalidation: close back below $52.00. (25% probability)
PRICE TARGETS
- Target Price: $50.60 (4-day horizon; modest downside drift of ~3%, roughly 1.5 ATR, in a strong downtrend with heavy distribution)
- Expected Range: $48.30 to $53.60 (width $5.30 ≈ 10.1% of price; this is wider than the 2–4% typical for a 2–3 day window because of high volatility, ATR ≈ 3.2% of price, and 4 days of trading)
- Key Levels: Support at $50.50 (Nov 5 low / flag bottom), Resistance at $53.58 (EMA13, with VWAP at $52.76 just below)
OVERALL BIAS
OVERALL BIAS: BEARISH - Price is below all key moving averages, −DI dominates with ADX at 37, CMF is deeply negative (-0.40), and the post-crash consolidation resembles a bearish flag. The small MACD cross and RSI bounce suggest relief rallies are possible, but they face heavy resistance at EMA13 and VWAP.
This is educational analysis and not financial advice.